

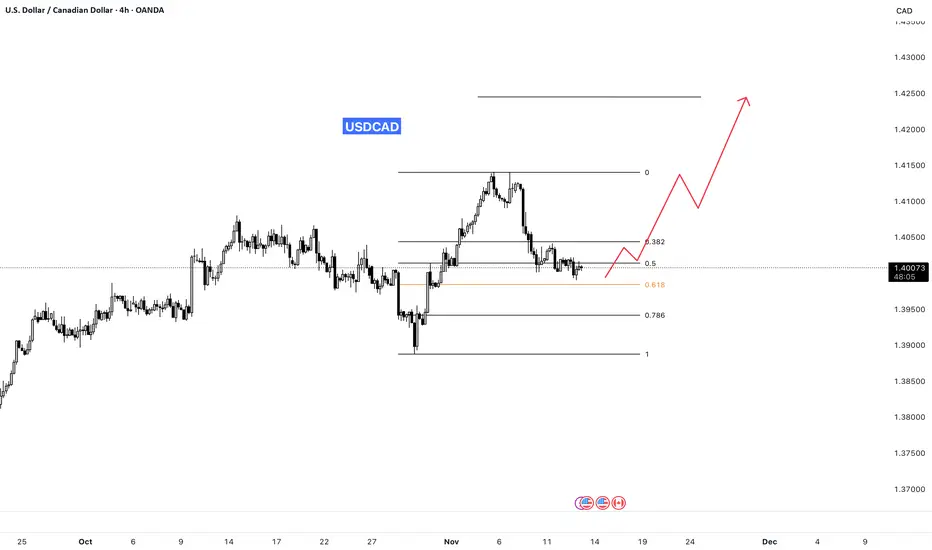
Identify Fibonacci Support Levels
Use Fibonacci retracement to find key support zones such as the 0.382, 0.5, and 0.618 levels where price often reacts or reverses.
Wait for Reversal Confirmation
Enter only after confirming a trend reversal on the 1-hour chart using candlestick patterns (like engulfing or pin bars), RSI divergence, or a structure break.
Maintain RRR of 1:3
Plan every trade with at least a 1:3 risk-to-reward ratio for every 1% you risk, aim to gain 3%.
Follow Strict Risk Management
Never risk more than 2% of your account balance on a single trade. Adjust your lot size based on stop-loss distance to protect your capital.
Use Fibonacci retracement to find key support zones such as the 0.382, 0.5, and 0.618 levels where price often reacts or reverses.
Wait for Reversal Confirmation
Enter only after confirming a trend reversal on the 1-hour chart using candlestick patterns (like engulfing or pin bars), RSI divergence, or a structure break.
Maintain RRR of 1:3
Plan every trade with at least a 1:3 risk-to-reward ratio for every 1% you risk, aim to gain 3%.
Follow Strict Risk Management
Never risk more than 2% of your account balance on a single trade. Adjust your lot size based on stop-loss distance to protect your capital.

免責聲明
這些資訊和出版物並非旨在提供,也不構成TradingView提供或認可的任何形式的財務、投資、交易或其他類型的建議或推薦。請閱讀使用條款以了解更多資訊。
免責聲明
這些資訊和出版物並非旨在提供,也不構成TradingView提供或認可的任何形式的財務、投資、交易或其他類型的建議或推薦。請閱讀使用條款以了解更多資訊。