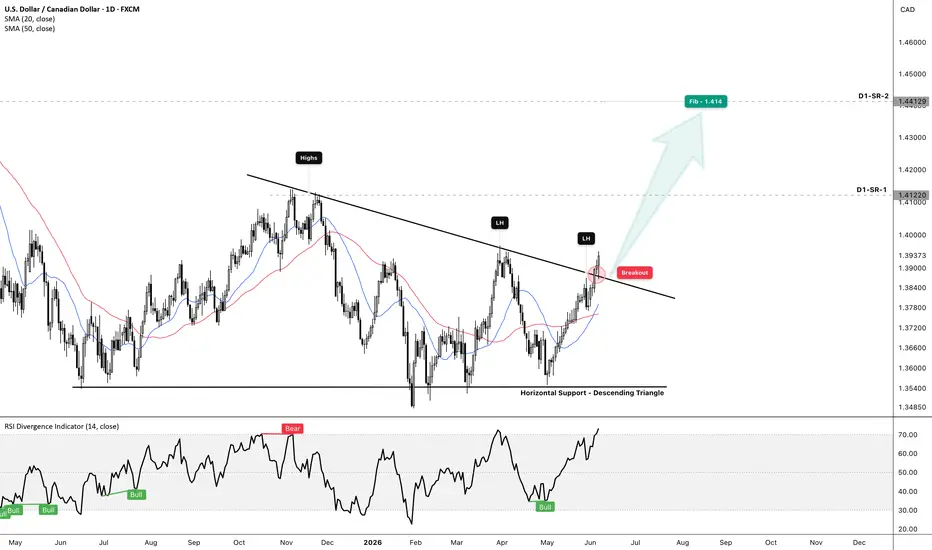

 USDCAD is currently emerging from a broader consolidation phase, with price respecting a long-term descending triangle structure that has capped bullish momentum for several months.
Throughout the formation, sellers consistently defended the descending trendline while buyers repeatedly protected the horizontal support zone, creating a compression pattern typical of a descending triangle.
Recently, price has broken above the triangle resistance on the Daily timeframe, signaling a potential transition from consolidation into bullish expansion. This breakout developed after a series of higher lows on the H4 TF after the last major rejection of the triangle base, indicating increasing buying pressure beneath resistance.
📝 Key confluences:
🔹 Daily descending triangle breakout
🔹 Bullish MA 20/50 crossover alignment
🔹 Bullish RSI strength
🔹 Successful breakout trend retest on H4
We’ve now seen a confirmed breakout on the Daily timeframe, with momentum supporting continuation toward higher resistance levels.
📈 Bias: Bullish
As long as price remains above the broken trendline and continues holding the breakout structure, the expectation is continuation towards:
◘ D1-SR-1 around 1.4122
◘ D1-SR-2 / Fib 1.414 extension around 1.4413
📌 Any pullbacks into the broken trendline or moving averages could offer buying opportunities, not selling opportunities.
⚠️ Invalidation:
A sustained move back below the triangle resistance and loss of the breakout structure would weaken this bullish outlook.
Bottom line:
This is no longer a range-bound market. The breakout suggests a shift toward bullish continuation, with buyers attempting to drive price toward higher daily resistance levels.

The NFX Team ™️💚
相關出版品
免責聲明
這些資訊和出版物並非旨在提供,也不構成TradingView提供或認可的任何形式的財務、投資、交易或其他類型的建議或推薦。請閱讀使用條款以了解更多資訊。
The NFX Team ™️💚
相關出版品
免責聲明
這些資訊和出版物並非旨在提供,也不構成TradingView提供或認可的任何形式的財務、投資、交易或其他類型的建議或推薦。請閱讀使用條款以了解更多資訊。