

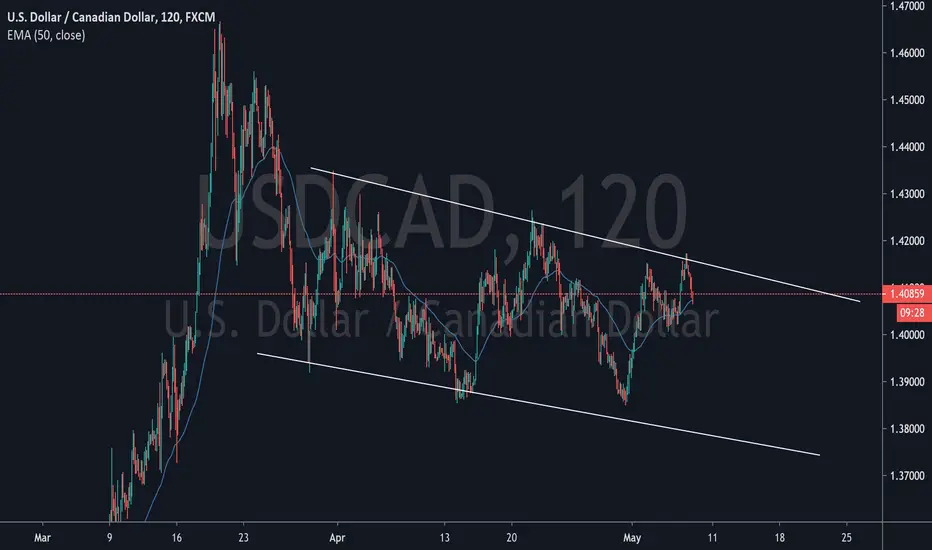
– Time = 2H
– Structure = Downtrend
– Pattern = Downtrend channel
– Tendency = Downtrend
– Monthly Candle retests Fibonacci resistance.
– 4hr Chart indicates an inverse hummer retested at the dynamic resistance level
– Price created a downtrend channel forming LH and LL.
– Hence the EMA 50 day is below the price, my analysis indicates a BEARISH MARKET
-----------------
Disclaimer: Forex trading and trading in other leveraged products involves a significant level of risk and is not suitable for all investors.
– Structure = Downtrend
– Pattern = Downtrend channel
– Tendency = Downtrend
– Monthly Candle retests Fibonacci resistance.
– 4hr Chart indicates an inverse hummer retested at the dynamic resistance level
– Price created a downtrend channel forming LH and LL.
– Hence the EMA 50 day is below the price, my analysis indicates a BEARISH MARKET
-----------------
Disclaimer: Forex trading and trading in other leveraged products involves a significant level of risk and is not suitable for all investors.
交易結束:目標達成

免責聲明
這些資訊和出版物並非旨在提供,也不構成TradingView提供或認可的任何形式的財務、投資、交易或其他類型的建議或推薦。請閱讀使用條款以了解更多資訊。