

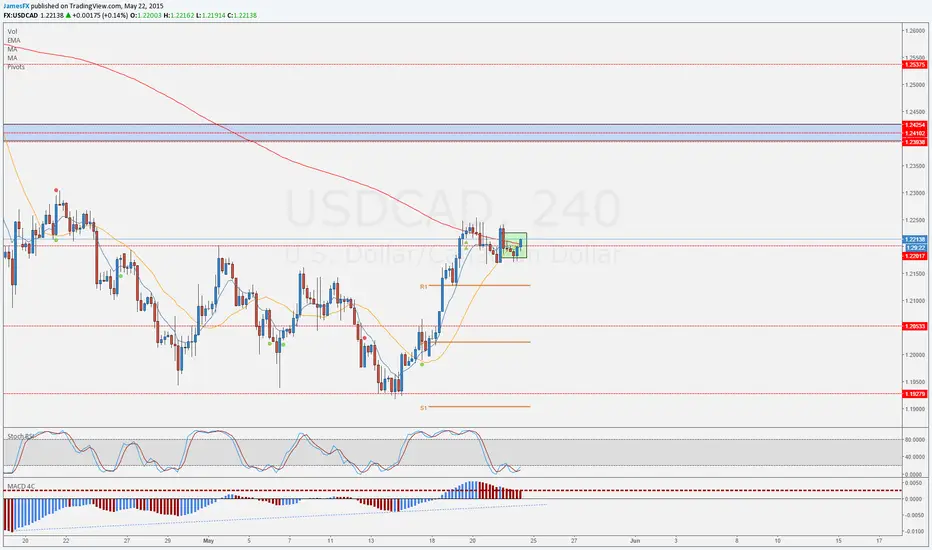
Represented by the Green box, we can see a convergence of EMAs and MAs as i mentioned in the last post. EMA is crossing to the upside and StochRSI signal is also crossing to the upside, MACD still shows a bullish divergence if zoomed out, represented by the blue dotted line. My next target is the zone represented by the blue box as this is a major level if you look back on price action. Happy trading!

免責聲明
這些資訊和出版物並非旨在提供,也不構成TradingView提供或認可的任何形式的財務、投資、交易或其他類型的建議或推薦。請閱讀使用條款以了解更多資訊。