

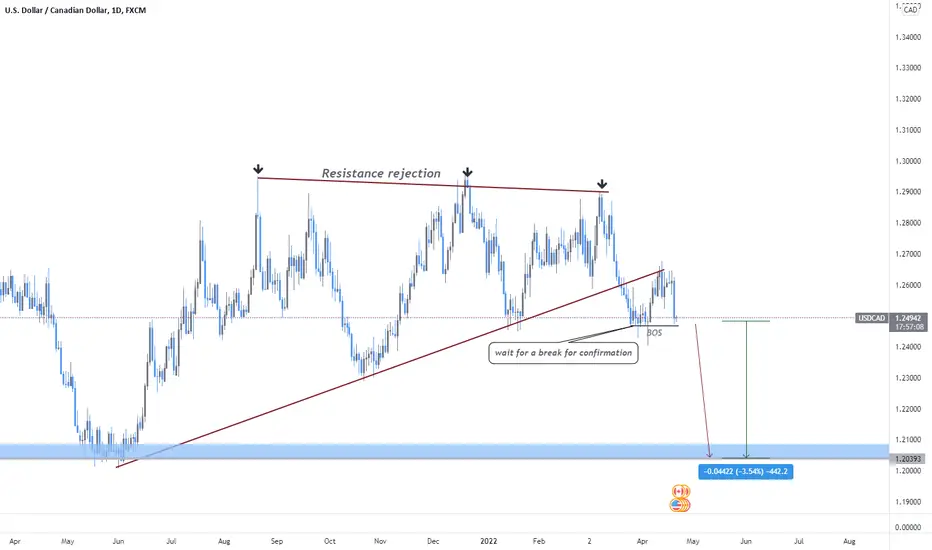
Ascending Triangle
An ascending triangle is a type of triangle chart pattern that occurs when there is a resistance level and a slope of higher lows.
What happens during this time is that there is a certain level that the buyers cannot seem to exceed. However, they are gradually starting to push the price up as evidenced by the higher lows.
you can see that the buyers are starting to gain strength because they are making higher lows.
They keep putting pressure on that resistance level and as a result, a breakout is bound
In this scenario, the buyers lost the battle and the price proceeded to dive! You can see that the drop was approximately the same distance as the height of the triangle formation.
A break below 1.24596, could drive price lower

免責聲明
這些資訊和出版物並非旨在提供,也不構成TradingView提供或認可的任何形式的財務、投資、交易或其他類型的建議或推薦。請閱讀使用條款以了解更多資訊。
免責聲明
這些資訊和出版物並非旨在提供,也不構成TradingView提供或認可的任何形式的財務、投資、交易或其他類型的建議或推薦。請閱讀使用條款以了解更多資訊。