

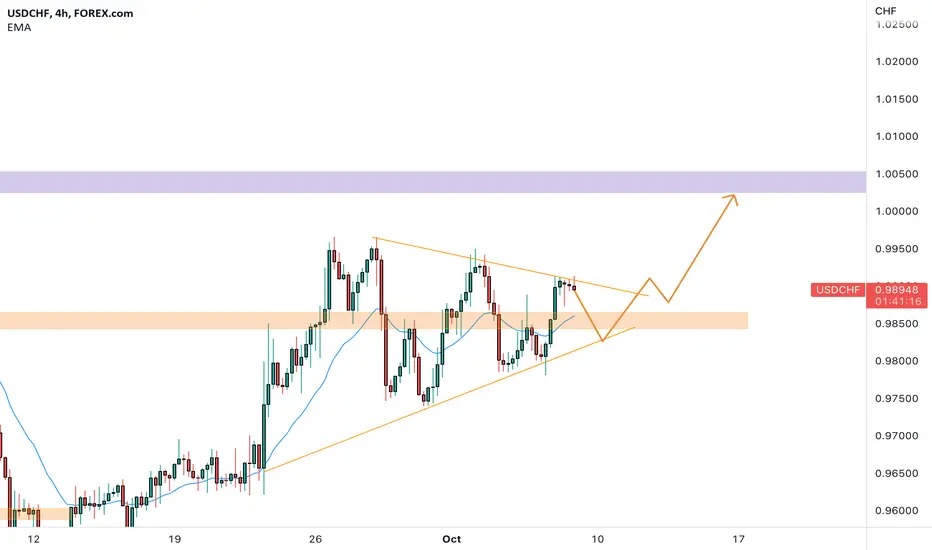
USDCHF on the 4h chart is moving between 2 converging trendlines.
The price after the last test of the upper trendline is retracing lower and possibly today after the NFP we can see a break above.
How can i approach this scenario?
I will wait for a potential break of the dynamic resistance and when that will happen i will look for a nice long order according to the PLancton's strategy rules.
--––
Follow the Shrimp 🦐
Keep in mind.
🟣 Purple structure -> Monthly structure.
🔴 Red structure -> Weekly structure.
🔵 Blue structure -> Daily structure.
🟡 Yellow structure -> 4h structure.
⚫️ Black structure -> <4h structure.
Here is the Plancton0618 technical analysis , please comment below if you have any question.
The ENTRY in the market will be taken only if the condition of the Plancton0618 strategy will trigger.
The price after the last test of the upper trendline is retracing lower and possibly today after the NFP we can see a break above.
How can i approach this scenario?
I will wait for a potential break of the dynamic resistance and when that will happen i will look for a nice long order according to the PLancton's strategy rules.
--––
Follow the Shrimp 🦐
Keep in mind.
🟣 Purple structure -> Monthly structure.
🔴 Red structure -> Weekly structure.
🔵 Blue structure -> Daily structure.
🟡 Yellow structure -> 4h structure.
⚫️ Black structure -> <4h structure.
Here is the Plancton0618 technical analysis , please comment below if you have any question.
The ENTRY in the market will be taken only if the condition of the Plancton0618 strategy will trigger.
註釋
註釋
註釋
註釋
註釋
Test of the strong resistance 註釋

免責聲明
這些資訊和出版物並非旨在提供,也不構成TradingView提供或認可的任何形式的財務、投資、交易或其他類型的建議或推薦。請閱讀使用條款以了解更多資訊。