

D1 and H4 are both showing the overall trend is still down.
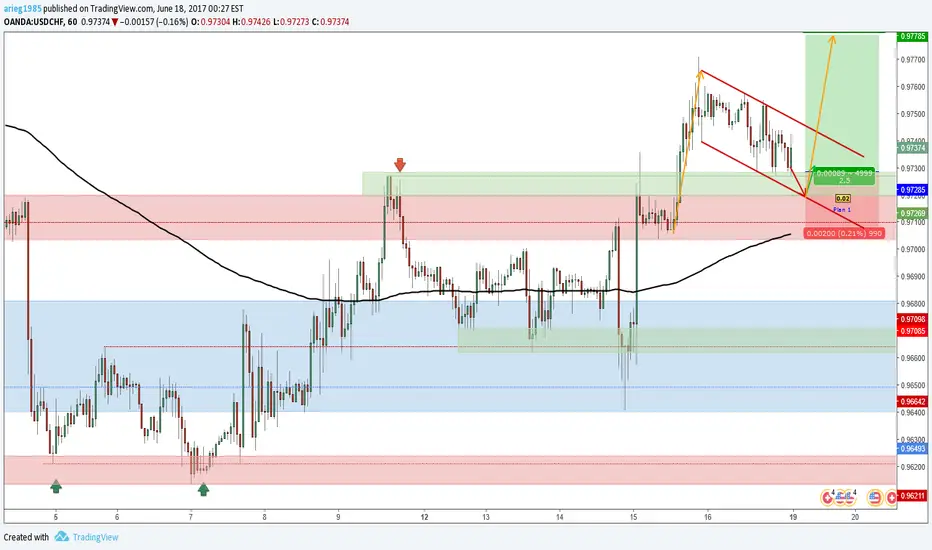
In H1, price is moving up above MA200 and hold above previous resistance area turns to support 0.97197-0.97283. Currently, price is forming Bullish Flag Pattern.
If price pull back to this area and rejected up (even better if breaks up flag pattern), can consider to long the market to follow the current momentum to the upside.
However, since the majority of trend is still down, trade this long position with limited target.
With Stop Loss 20 pips and Target Profit 50 pips, the potential trade offers 2.50 Reward-To-Risk Ratio.

免責聲明
這些資訊和出版物並非旨在提供,也不構成TradingView提供或認可的任何形式的財務、投資、交易或其他類型的建議或推薦。請閱讀使用條款以了解更多資訊。