

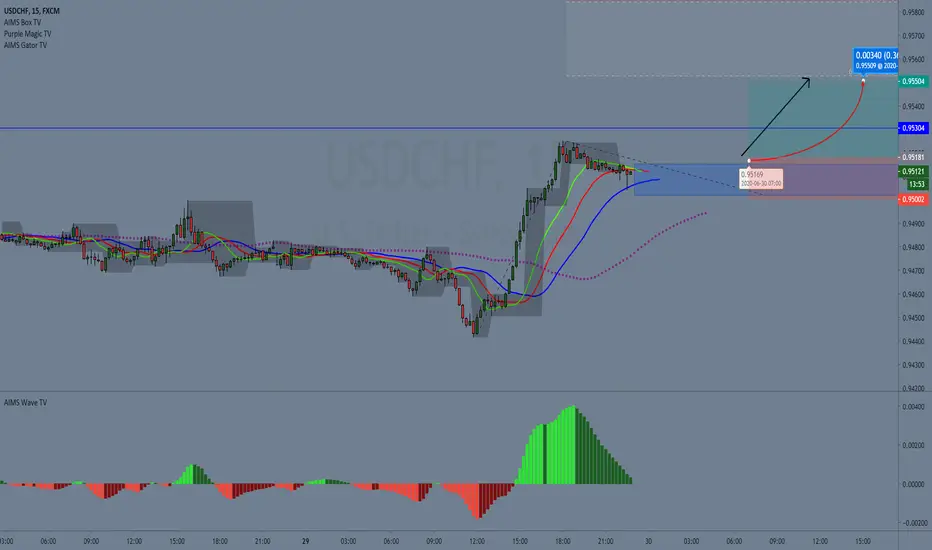
This is a price pattern that I like to call the FAMOUS setup.
It allows me to forecast the market at 10 pm UK time before going to bed.
I see this pattern 10-12 hrs in advance. And so the prediction is that provided that it stays within this boxed range, as shown on the chart...
It will break out into wave 5 on the M15 chart.
I should go and hit Target Zone 1, i.e the Fib Expansion 62%.
What will invalidate the signal?
If price did not stay within sideways box region, I..e if it goes up into wave 5 without going sideways first
or if it retraces more than 50%.
It allows me to forecast the market at 10 pm UK time before going to bed.
I see this pattern 10-12 hrs in advance. And so the prediction is that provided that it stays within this boxed range, as shown on the chart...
It will break out into wave 5 on the M15 chart.
I should go and hit Target Zone 1, i.e the Fib Expansion 62%.
What will invalidate the signal?
If price did not stay within sideways box region, I..e if it goes up into wave 5 without going sideways first
or if it retraces more than 50%.
註釋
The blue line on the chart was taken from the D1 Box High. It was a potential resistance level It appears that it's hit it and stalling around it.
To get our premium tools visit: itradeaims.net
免責聲明
這些資訊和出版物並非旨在提供,也不構成TradingView提供或認可的任何形式的財務、投資、交易或其他類型的建議或推薦。請閱讀使用條款以了解更多資訊。
To get our premium tools visit: itradeaims.net
免責聲明
這些資訊和出版物並非旨在提供,也不構成TradingView提供或認可的任何形式的財務、投資、交易或其他類型的建議或推薦。請閱讀使用條款以了解更多資訊。