

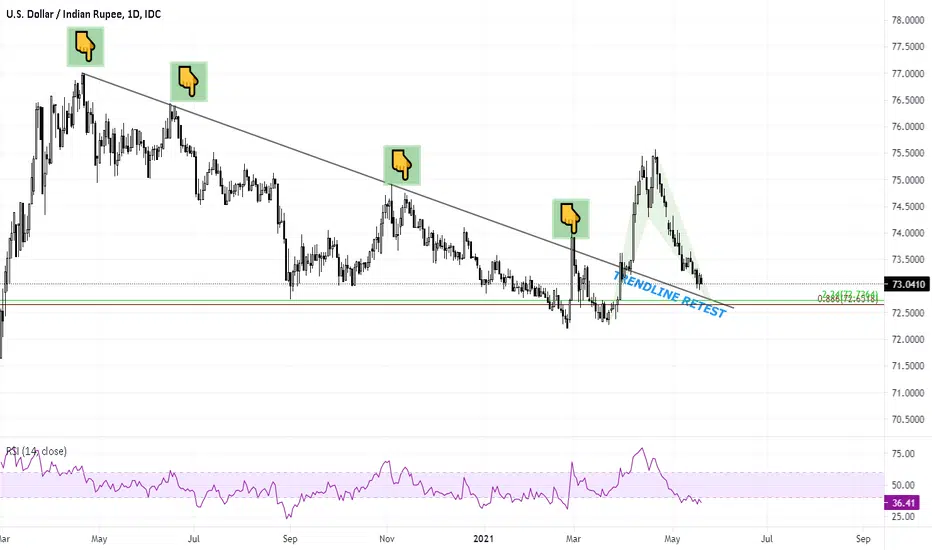
The current structure of USDINR is still weak and is probably moving towards 72.65 levels.
The current chart shows two technical possibilities that suggest goos support zone in the 72-73 range.
At First, there is trendline support, that the prices broke in April 2021, and the same trendline would now act as a support.
Secondly, there is also a harmonic pattern probability whose support also coincides with the trendline support.
So keep your eyes on price action, and be ready to take advantage of solid support.
If you are trading this, you are trading at your own risk
The current chart shows two technical possibilities that suggest goos support zone in the 72-73 range.
At First, there is trendline support, that the prices broke in April 2021, and the same trendline would now act as a support.
Secondly, there is also a harmonic pattern probability whose support also coincides with the trendline support.
So keep your eyes on price action, and be ready to take advantage of solid support.
If you are trading this, you are trading at your own risk

免責聲明
這些資訊和出版物並非旨在提供,也不構成TradingView提供或認可的任何形式的財務、投資、交易或其他類型的建議或推薦。請閱讀使用條款以了解更多資訊。
免責聲明
這些資訊和出版物並非旨在提供,也不構成TradingView提供或認可的任何形式的財務、投資、交易或其他類型的建議或推薦。請閱讀使用條款以了解更多資訊。