

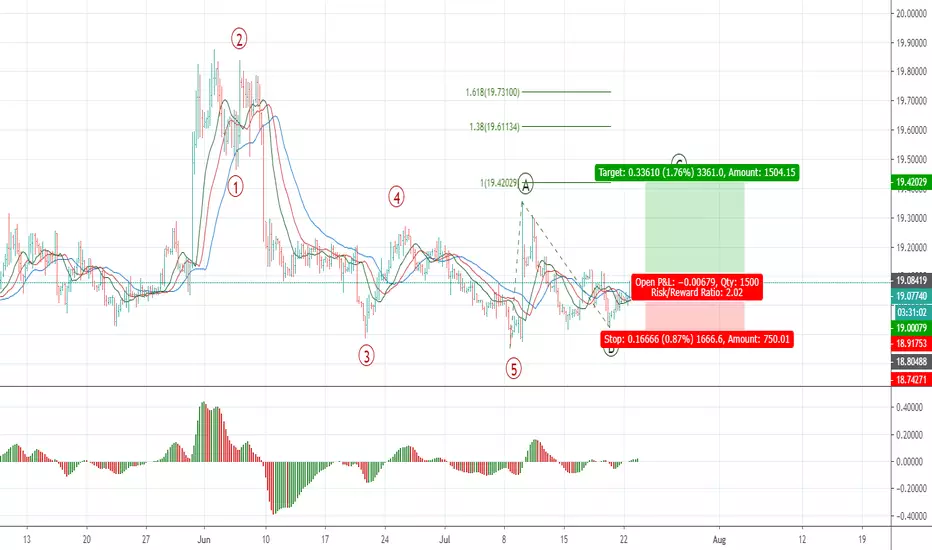
On the H4 chart of USDMXN, the price has formed a promising buy fractal above the balance MAs with AO indicator over the zero line. This signal is supported by Elliott wave structure: with high probability, we are moving in an ABC corrective zigzag, more accurately, in wave C. This gives me an idea to go long using levels that are marked on the chart.

免責聲明
這些資訊和出版物並非旨在提供,也不構成TradingView提供或認可的任何形式的財務、投資、交易或其他類型的建議或推薦。請閱讀使用條款以了解更多資訊。
免責聲明
這些資訊和出版物並非旨在提供,也不構成TradingView提供或認可的任何形式的財務、投資、交易或其他類型的建議或推薦。請閱讀使用條款以了解更多資訊。