
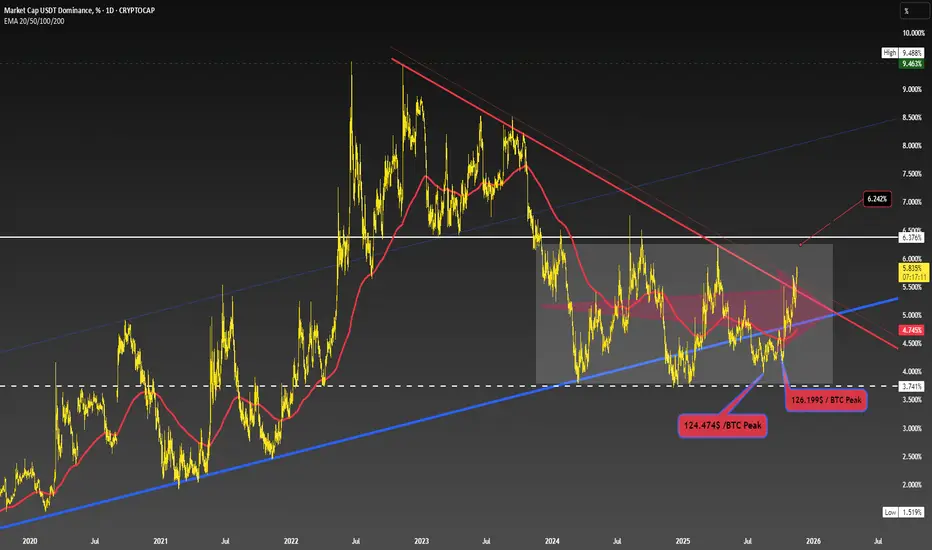
You can clearly see a descending structure here, but the sideways movement between 3.74% and 6.37% is also quite notable. The 6.24% level stands out as the first key resistance target.
If 6.24% fails to break and hold above, a pullback may occur.
So this region is crucial for determining whether USDT Dominance will continue higher or reject and reverse.
Also, the 6.24% level in USDT.D corresponds approximately to a $90,500 BTC price, making this zone even more important to watch.
If 6.24% fails to break and hold above, a pullback may occur.
So this region is crucial for determining whether USDT Dominance will continue higher or reject and reverse.
Also, the 6.24% level in USDT.D corresponds approximately to a $90,500 BTC price, making this zone even more important to watch.
註釋
This is not financial advice.
免責聲明
這些資訊和出版物並非旨在提供,也不構成TradingView提供或認可的任何形式的財務、投資、交易或其他類型的建議或推薦。請閱讀使用條款以了解更多資訊。