
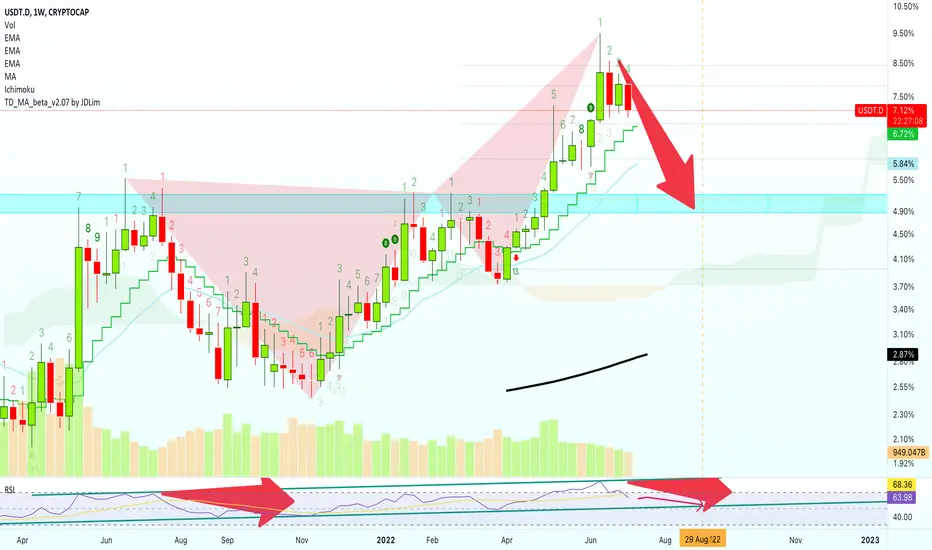
When looking at the weekly chart for USDT.D (Tether Dominance Index), we can notice a full red/bearish candle.
We have a rising channel also breaking bearish:
Together with a bearish harmonic pattern.
The RSI is pointing straight down:
One last signal is MA200, the black line on the chart.
We can see it rising and we know that prices tend to gravitate towards this line.
As MA200 trends up, USDT.D trends down.
Namaste.
We have a rising channel also breaking bearish:
Together with a bearish harmonic pattern.
The RSI is pointing straight down:
One last signal is MA200, the black line on the chart.
We can see it rising and we know that prices tend to gravitate towards this line.
As MA200 trends up, USDT.D trends down.
Namaste.

Trading Cryptocurrencies can be the hardest undertaking ever without the right trade-numbers, without accurate private-access information. Free is free, but the best always requires sweat, an investment. Since 2017 👇
t.me/masteranandatrades/8778
t.me/masteranandatrades/8778
相關出版品
免責聲明
這些資訊和出版物並非旨在提供,也不構成TradingView提供或認可的任何形式的財務、投資、交易或其他類型的建議或推薦。請閱讀使用條款以了解更多資訊。
Trading Cryptocurrencies can be the hardest undertaking ever without the right trade-numbers, without accurate private-access information. Free is free, but the best always requires sweat, an investment. Since 2017 👇
t.me/masteranandatrades/8778
t.me/masteranandatrades/8778
相關出版品
免責聲明
這些資訊和出版物並非旨在提供,也不構成TradingView提供或認可的任何形式的財務、投資、交易或其他類型的建議或推薦。請閱讀使用條款以了解更多資訊。