
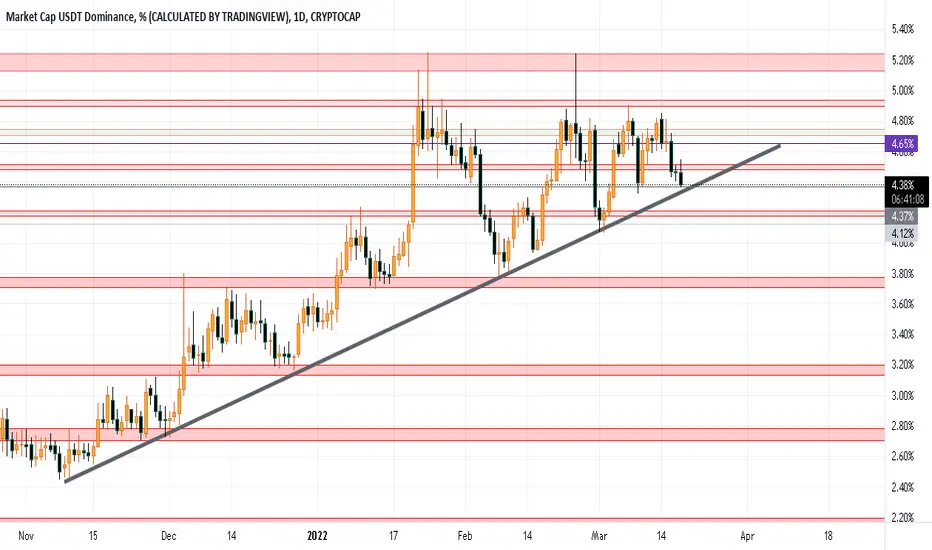
Guys this is USDT.D Chart, this chart indicates a ViceVersa movement with the overall crypto currency market! That means whenever USDT.D drops the market is Bullish, and whenever it moves up the market turns Bearish!
So right now we can see that USDT.D is in an important area, Keep an eye on the support trendline maybe it get supported and the market turn Bearish for short term! so then we can open Short positions with a good risk management! or if the support trend line got broken, then we will wait for a pullback for a confirmation for a extreme Bullish market!
Please check my previous technical Analysis ideas link below!

相關出版品
免責聲明
這些資訊和出版物並非旨在提供,也不構成TradingView提供或認可的任何形式的財務、投資、交易或其他類型的建議或推薦。請閱讀使用條款以了解更多資訊。