
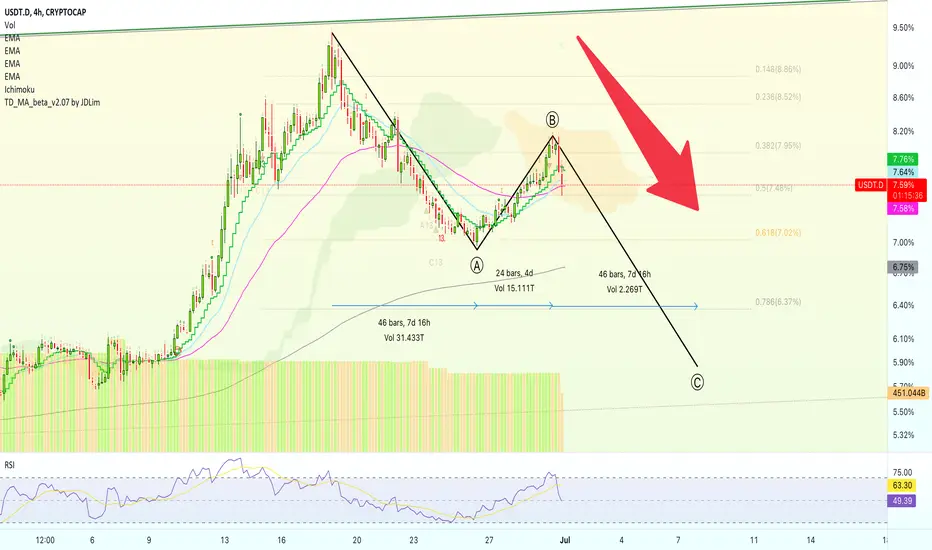
Looks like we have the complete b wave of the ABC correction we mapped a few days ago.
We can see EMA50 holding as support after a higher low.
This is set at 7.58%; This level is very likely to fail.
The RSI has gone bearish (below 50) and we have a clear lower high.
The next target is set first at 7.02% followed by 6.37%.
If we see straight down, as the chart is saying, Bitcoin will move straight up.
Namaste.

✅ Cryptocurrencies technical analysis & results
t.me/masteranandatrades/9279
✅ Stocks technical analysis
t.me/anandastocks
✅ Enjoyed the content? Join my PREMIUM channels for more... t.me/lamatrades/4 (since 2017)
t.me/masteranandatrades/9279
✅ Stocks technical analysis
t.me/anandastocks
✅ Enjoyed the content? Join my PREMIUM channels for more... t.me/lamatrades/4 (since 2017)
相關出版品
免責聲明
這些資訊和出版物並非旨在提供,也不構成TradingView提供或認可的任何形式的財務、投資、交易或其他類型的建議或推薦。請閱讀使用條款以了解更多資訊。