
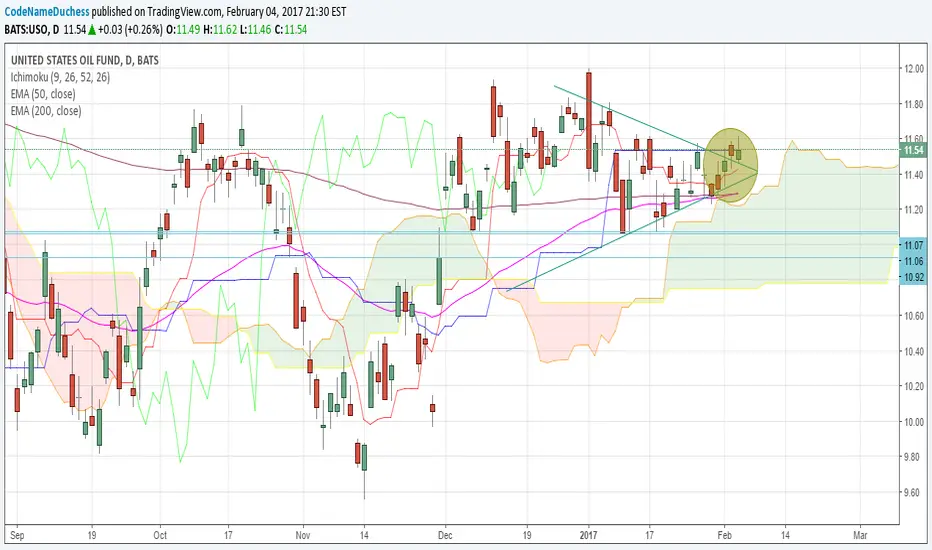
On the 1 day chart, price broke above the triangle pattern and is trying to cross above blue base line. The lagging line is also attempting to cross up over price. Last, the 50 DMA is trying to cross up over the 200 DMA. Thanks for viewing my chart. I'm new to charting/trading, so any corrections or help would be appreciated.

免責聲明
這些資訊和出版物並非旨在提供,也不構成TradingView提供或認可的任何形式的財務、投資、交易或其他類型的建議或推薦。請閱讀使用條款以了解更多資訊。
免責聲明
這些資訊和出版物並非旨在提供,也不構成TradingView提供或認可的任何形式的財務、投資、交易或其他類型的建議或推薦。請閱讀使用條款以了解更多資訊。