
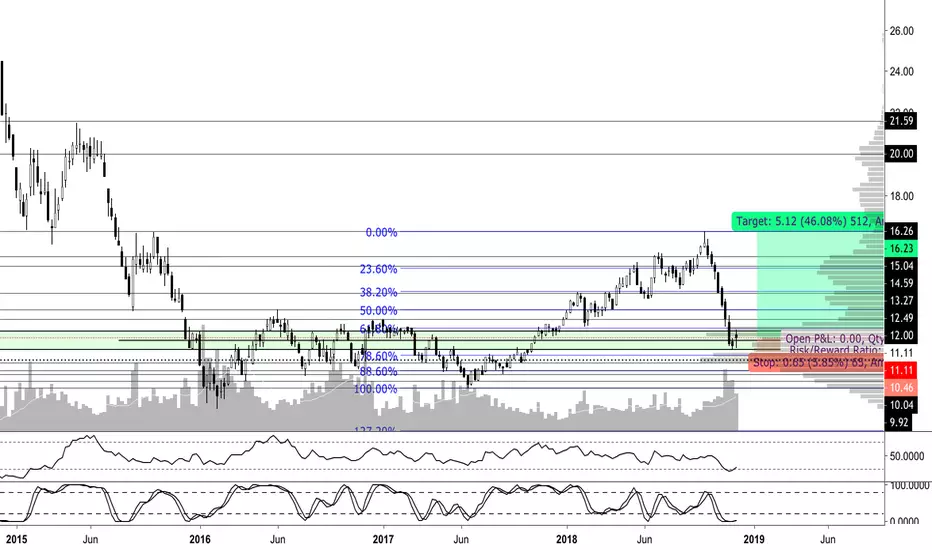
RSI+ROC have not been this low since early 2015/late 2014
Forming reversal candles on the weekly chart
SRSI and RSI+ROC are starting to curl up
Horizontals marked are the S/R levels to watch for possible rejections and bounces
Prices of each level are on the right side of the chart
----------------------------------------------------------------------
Possible trade for USO
Buy $11.11
Stop loss $10.46
Ultimate target $16.26

免責聲明
這些資訊和出版物並非旨在提供,也不構成TradingView提供或認可的任何形式的財務、投資、交易或其他類型的建議或推薦。請閱讀使用條款以了解更多資訊。
免責聲明
這些資訊和出版物並非旨在提供,也不構成TradingView提供或認可的任何形式的財務、投資、交易或其他類型的建議或推薦。請閱讀使用條款以了解更多資訊。