
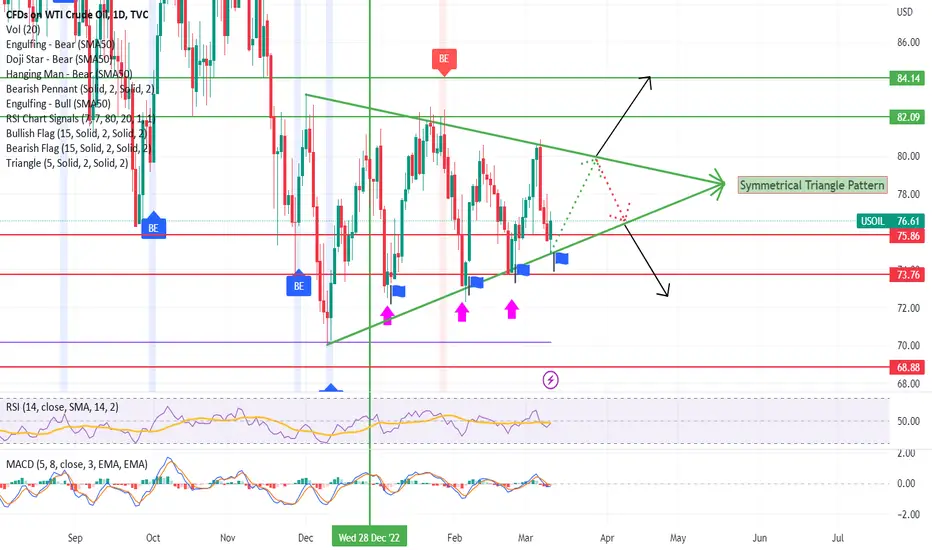
WTI Oil has formed a symmetrical triangle pattern on the price chart, which is a technical analysis pattern that appears when the highs and lows of the price action converge towards each other, forming a triangle shape. This pattern indicates a period of consolidation or indecision in the market, as buyers and sellers are evenly matched, causing the price to fluctuate within a tight range. Traders often watch for a confirmation of either a breakout or breakdown from this pattern, which can indicate a potential trend reversal or continuation. It's important to use additional indicators such as volume, momentum, and moving averages to confirm and evaluate the strength of the move before taking action. The crucial area to monitor is illustrated on the chart, and traders should be cautious of false breakouts.
Make necessary move during this breakout or breakdown.
Make necessary move during this breakout or breakdown.

免責聲明
這些資訊和出版物並非旨在提供,也不構成TradingView提供或認可的任何形式的財務、投資、交易或其他類型的建議或推薦。請閱讀使用條款以了解更多資訊。
免責聲明
這些資訊和出版物並非旨在提供,也不構成TradingView提供或認可的任何形式的財務、投資、交易或其他類型的建議或推薦。請閱讀使用條款以了解更多資訊。