
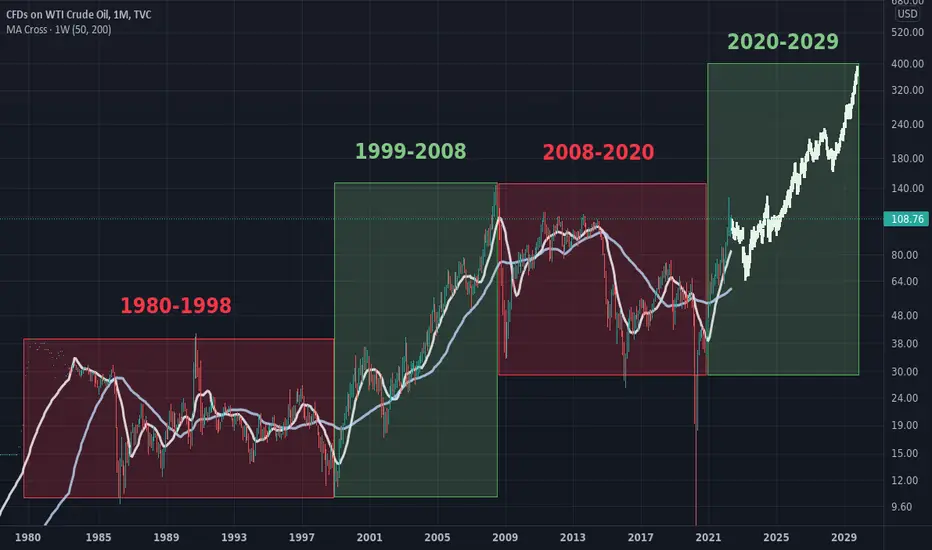
If a deleveraging like 1999 is happening, perhaps we will see 1999-2008 in oil play out in a similar fashion? Not saying it will or won't happen, but it currently looks like oil is setting up momentum for a future breakout.
I copied the bars pattern from 1999 to 2008. Maybe it's too bullish? Or maybe not bullish enough. I would venture to say that it seems so much worse than 1999, the prediction isn't bullish enough, but I'm not sure.
What do you think?
Good luck and don't forget to hedge your bets :)
I copied the bars pattern from 1999 to 2008. Maybe it's too bullish? Or maybe not bullish enough. I would venture to say that it seems so much worse than 1999, the prediction isn't bullish enough, but I'm not sure.
What do you think?
Good luck and don't forget to hedge your bets :)
註釋
Correction. bars pattern is actually from ~Jan 2001 to 2008註釋
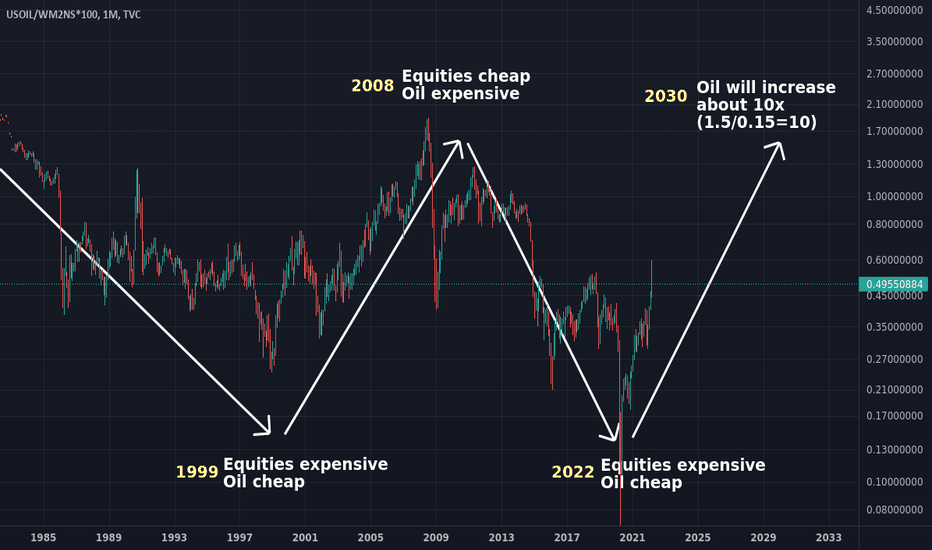
I'd like to give a BIG thanks to everyone for your feedback! Here's a few similar ideas that inspired this chart that you might also critique or enjoy:M2 Adjusted Oil:
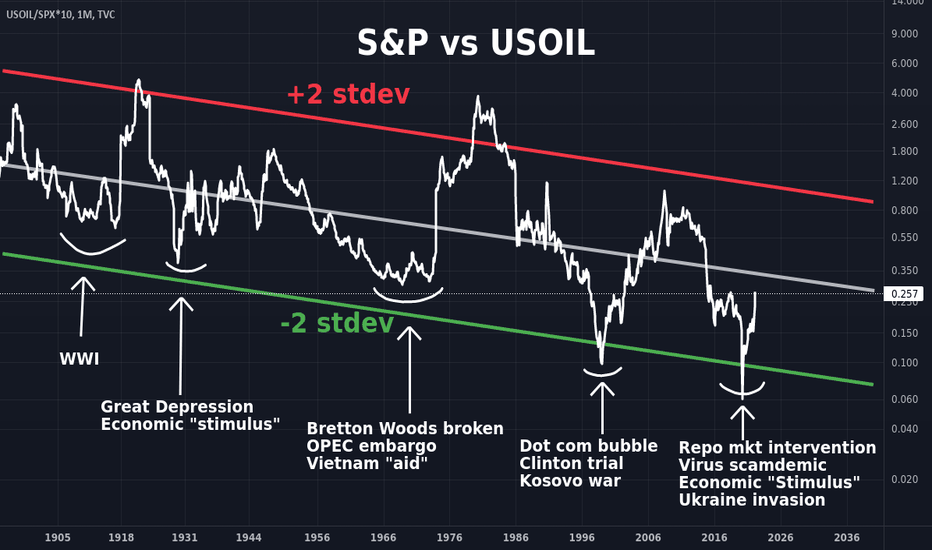
S&P vs Oil:
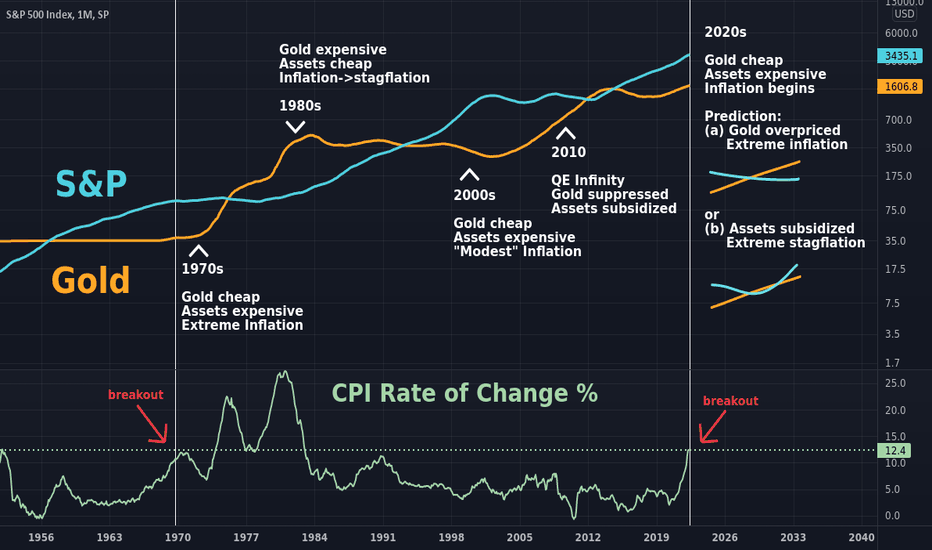
S&P vs Gold (suppose gold might breakout similarly to oil)
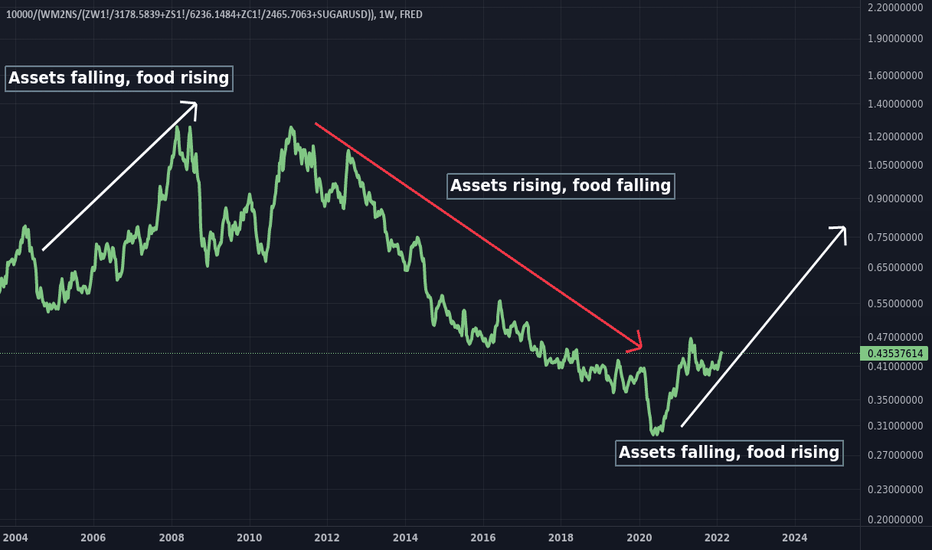
M2 Adjusted soy/wheat/corn/sugar:

免責聲明
這些資訊和出版物並非旨在提供,也不構成TradingView提供或認可的任何形式的財務、投資、交易或其他類型的建議或推薦。請閱讀使用條款以了解更多資訊。
免責聲明
這些資訊和出版物並非旨在提供,也不構成TradingView提供或認可的任何形式的財務、投資、交易或其他類型的建議或推薦。請閱讀使用條款以了解更多資訊。