
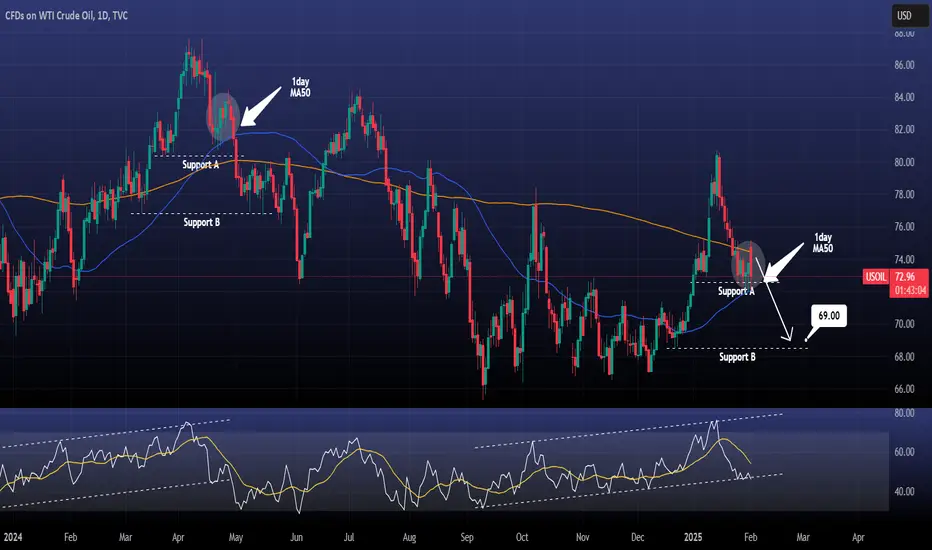
WTI Crude Oil / USOIL has tested and held the 1day MA50 for two straight days.
Today's volatile candle though suggests that one more test is possible and the last time we saw this pattern was in late April 2024.
The two patterns have similar 1day RSI fractals, so the sell trigger here is the 1day MA50.
If we cross under it, sell and target Support B at 69.00.
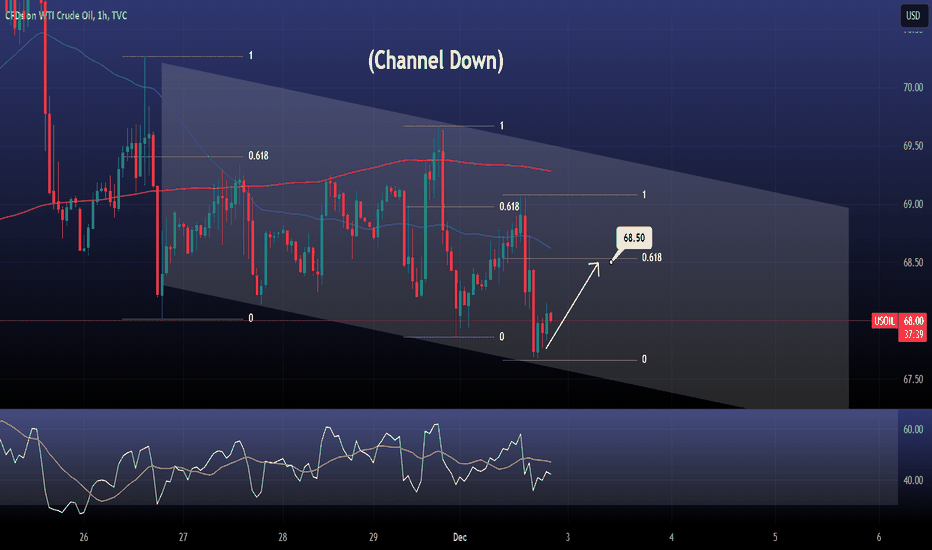
Previous chart:
Follow us, like the idea and leave a comment below!!
Today's volatile candle though suggests that one more test is possible and the last time we saw this pattern was in late April 2024.
The two patterns have similar 1day RSI fractals, so the sell trigger here is the 1day MA50.
If we cross under it, sell and target Support B at 69.00.
Previous chart:
Follow us, like the idea and leave a comment below!!

thecryptagon.com covers news & insights on global markets (crypto, forex, stocks, commodities)
Institutional services offered:
💰 Daily consulting
💰 Account management
💰 Mentorship
Contact: t.me/thecryptagon | info@thecryptagon.com
Institutional services offered:
💰 Daily consulting
💰 Account management
💰 Mentorship
Contact: t.me/thecryptagon | info@thecryptagon.com
免責聲明
這些資訊和出版物並非旨在提供,也不構成TradingView提供或認可的任何形式的財務、投資、交易或其他類型的建議或推薦。請閱讀使用條款以了解更多資訊。
thecryptagon.com covers news & insights on global markets (crypto, forex, stocks, commodities)
Institutional services offered:
💰 Daily consulting
💰 Account management
💰 Mentorship
Contact: t.me/thecryptagon | info@thecryptagon.com
Institutional services offered:
💰 Daily consulting
💰 Account management
💰 Mentorship
Contact: t.me/thecryptagon | info@thecryptagon.com
免責聲明
這些資訊和出版物並非旨在提供,也不構成TradingView提供或認可的任何形式的財務、投資、交易或其他類型的建議或推薦。請閱讀使用條款以了解更多資訊。