
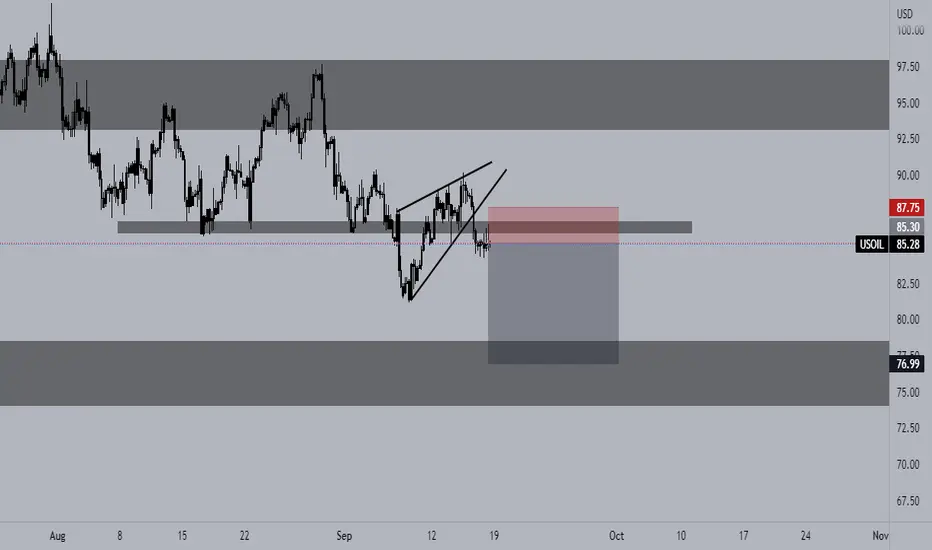
From the W1 timeframe, we can see a double top pattern that successfully broken the neckline confirming bearish pressure. Also, last weeks WI candle closed bearish confirming sell momentum.
On the D1, we can clearly see that price pulled back after what looked like a head and shoulders pattern and after failing to break the neckline slumped back below support. This also indicates strong bearish momentum.
Finally on my entry timeframe the H4, we see the ascending wedge which broke and came back to support to resistance before heading lower.

免責聲明
這些資訊和出版物並非旨在提供,也不構成TradingView提供或認可的任何形式的財務、投資、交易或其他類型的建議或推薦。請閱讀使用條款以了解更多資訊。
免責聲明
這些資訊和出版物並非旨在提供,也不構成TradingView提供或認可的任何形式的財務、投資、交易或其他類型的建議或推薦。請閱讀使用條款以了解更多資訊。