
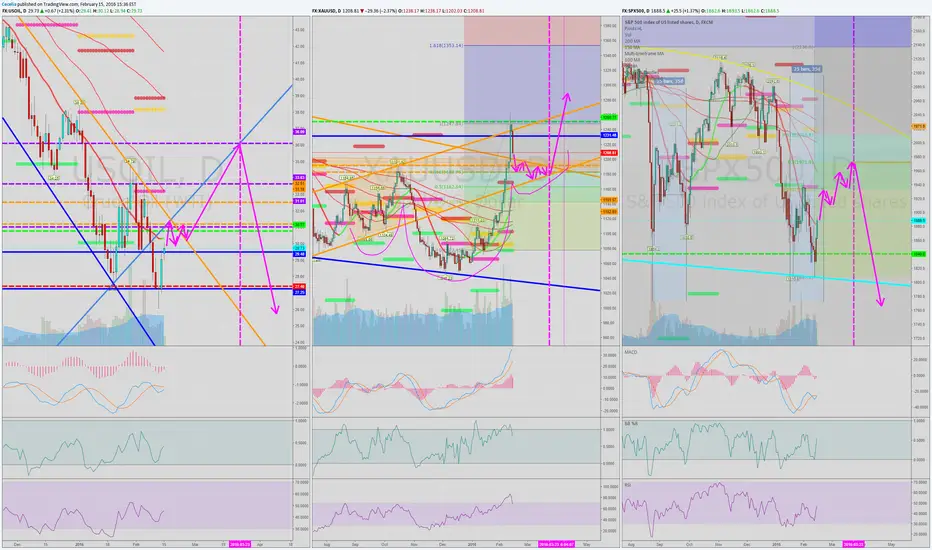
LEFT CHART Oil: I expect oil to hit the top of longterm channel (orange line) where it will likely be rejected softly, then break it again and retest... at about that point the 20DMA may cross the 50DMA which will cause a strong surge (like the past gold rush)... my PT 36,09 but could be higher.
MIDDLE CHART Gold: Looking for a possible H&S here, with a breach back into the long term channel, some flux for a bit and then the BIG move many believe is coming.
RIGHT CHART SPX: May test the middle of the W 1933ish is the next few days and then some flaggish movement towards a 50% retrace of losses from all time highs. Final PT 1973 with a sharp decline right after.
Since these 3 have had related movement patterns, I've done them all together - which could of course go WAY off course if any correlation breaks or changes... just some ideas if we stay on the same track for a bit.
MIDDLE CHART Gold: Looking for a possible H&S here, with a breach back into the long term channel, some flux for a bit and then the BIG move many believe is coming.
RIGHT CHART SPX: May test the middle of the W 1933ish is the next few days and then some flaggish movement towards a 50% retrace of losses from all time highs. Final PT 1973 with a sharp decline right after.
Since these 3 have had related movement patterns, I've done them all together - which could of course go WAY off course if any correlation breaks or changes... just some ideas if we stay on the same track for a bit.

免責聲明
這些資訊和出版物並非旨在提供,也不構成TradingView提供或認可的任何形式的財務、投資、交易或其他類型的建議或推薦。請閱讀使用條款以了解更多資訊。
免責聲明
這些資訊和出版物並非旨在提供,也不構成TradingView提供或認可的任何形式的財務、投資、交易或其他類型的建議或推薦。請閱讀使用條款以了解更多資訊。