
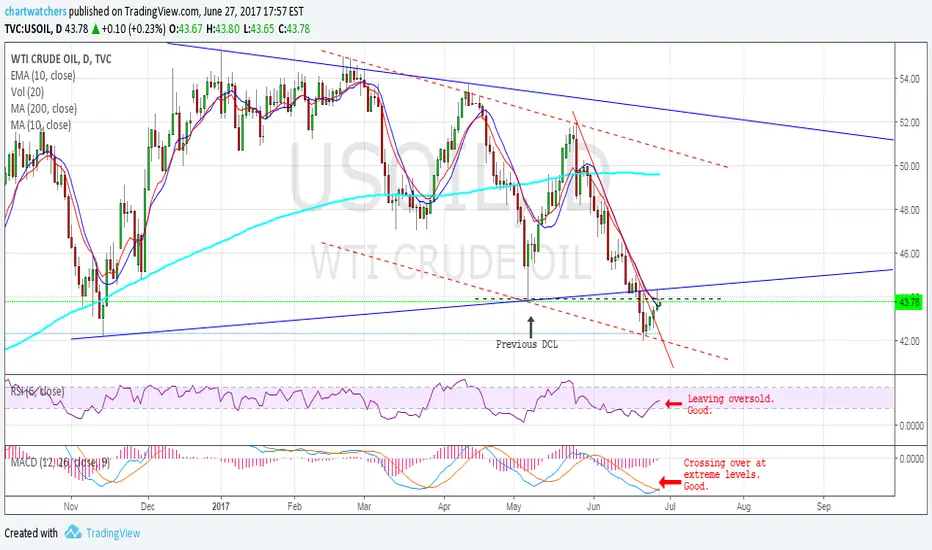
Yesterday we broke above the down trendline. Today price was above both the 10 EMA and 10 SMA almost whole day.
By the close we closed below both moving average. A close above the 10 EMA and 10 SMA will pull the big players into this market .
Indicators are showing signs of reversal : RSI has left oversold levels. MACD crossed over at extreme levels.
Notice how strong this level (44-44,5$) we need to break:
10 SMA
10 EMA
Blue trendline
Previous DCL
If we could successfully close above 44-44.5$ the bottom would be in.
The only thing concerns me the non-correlation between oil and the stock market... They should bounce hand in hand... It's hard to tell what would be if we had a correction in the SM... Today oil was bouncing while SM was correcting.
By the close we closed below both moving average. A close above the 10 EMA and 10 SMA will pull the big players into this market .
Indicators are showing signs of reversal : RSI has left oversold levels. MACD crossed over at extreme levels.
Notice how strong this level (44-44,5$) we need to break:
10 SMA
10 EMA
Blue trendline
Previous DCL
If we could successfully close above 44-44.5$ the bottom would be in.
The only thing concerns me the non-correlation between oil and the stock market... They should bounce hand in hand... It's hard to tell what would be if we had a correction in the SM... Today oil was bouncing while SM was correcting.

免責聲明
這些資訊和出版物並非旨在提供,也不構成TradingView提供或認可的任何形式的財務、投資、交易或其他類型的建議或推薦。請閱讀使用條款以了解更多資訊。
免責聲明
這些資訊和出版物並非旨在提供,也不構成TradingView提供或認可的任何形式的財務、投資、交易或其他類型的建議或推薦。請閱讀使用條款以了解更多資訊。