
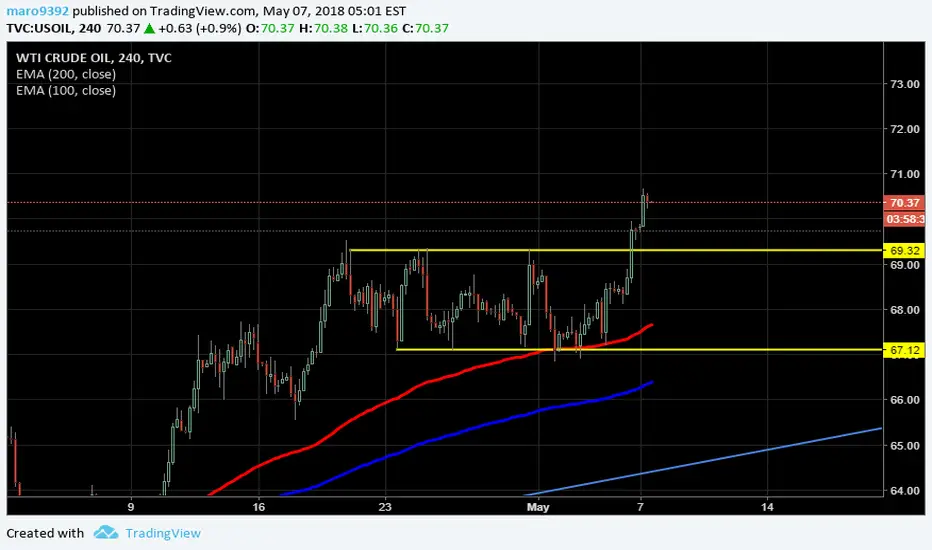
Hello traders! Today i want to show you USOIL in 4h timeframe , during the previous weeks the price moved inside a rectangle , a pattern that might indicate a continuation of the trend , in this case an uptrend or an inversion trend. EMA 100 acted as support and the price broke the rectangle and now is looking for another upside leg. We will monitor the area around 70 usd , to find some long position. Have a nice day traders!
註釋
in 4h timeframe broke the resistance but in daily timeframe hasn't been able to break it. Now is going higher , over previous highs , it might reach 80 usd area? We will see手動結束交易

免責聲明
這些資訊和出版物並非旨在提供,也不構成TradingView提供或認可的任何形式的財務、投資、交易或其他類型的建議或推薦。請閱讀使用條款以了解更多資訊。