
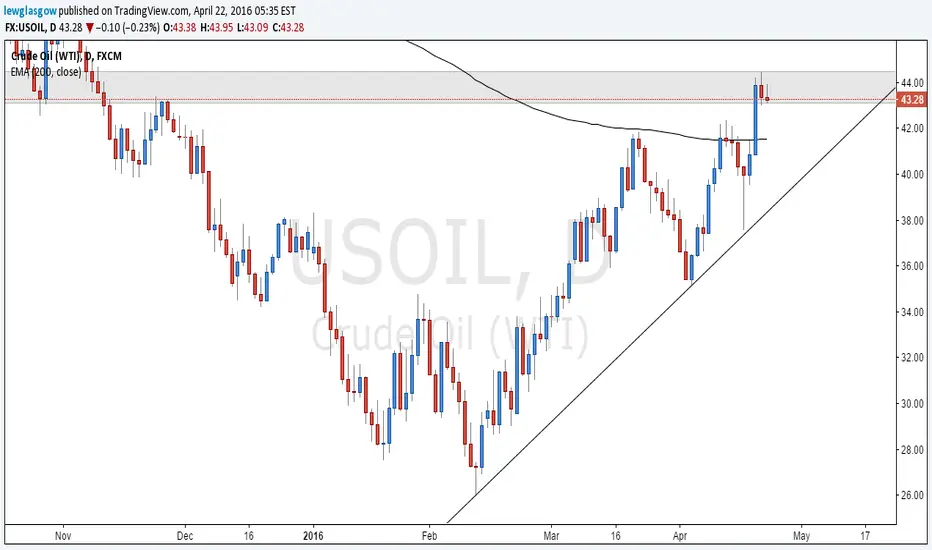
Once again we are looking at USOIL on a Daily chart with a potential shorting opportunity. I'm loving the look of this, you can see we have tested a major turning point in the market which has provided us with our future price direction.
We can clearly see that whenever price gets relatively close to our 200 EMA it changes direction very quickly, I can see price going short all the way down to our trendline and meeting our indicator in the same area.
We can clearly see that whenever price gets relatively close to our 200 EMA it changes direction very quickly, I can see price going short all the way down to our trendline and meeting our indicator in the same area.

📈 Master the Art and Science of Trading: sixfigurecapital.com
相關出版品
免責聲明
這些資訊和出版物並非旨在提供,也不構成TradingView提供或認可的任何形式的財務、投資、交易或其他類型的建議或推薦。請閱讀使用條款以了解更多資訊。
📈 Master the Art and Science of Trading: sixfigurecapital.com
相關出版品
免責聲明
這些資訊和出版物並非旨在提供,也不構成TradingView提供或認可的任何形式的財務、投資、交易或其他類型的建議或推薦。請閱讀使用條款以了解更多資訊。