
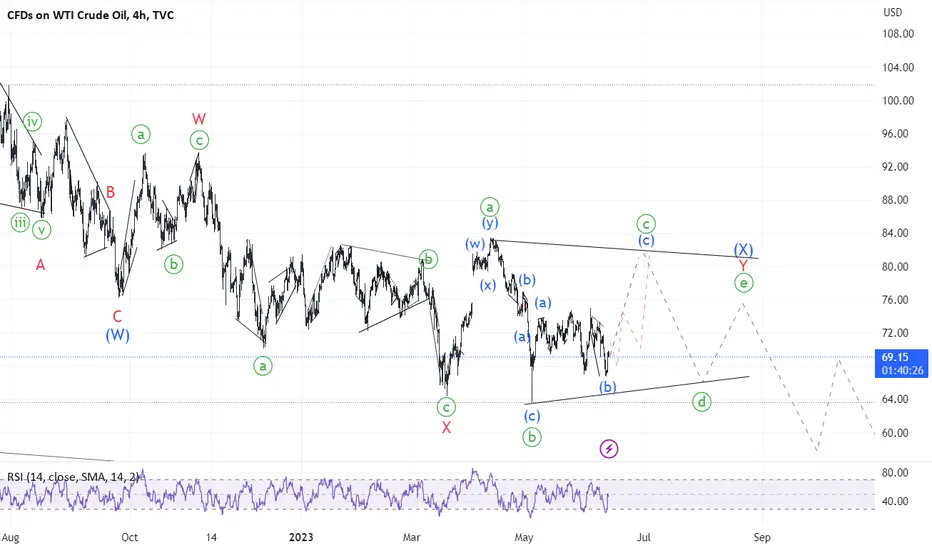
I think I just decoded the oil chart. I have been contemplating a rise to $90+ because I expected ABC flat where I now see WXY combination of zigzag, zigzag and triangle. The chart now perfectly aligns with Brent where wave [[]B] did make lowest low presumably shaping a symmetrical triangle whereas WTI is working on a running triangle.
That means that we have only strong push left upwards from current low which should come either as a straight impulse or an expanding diagonal which will be extremely annoying.
That means that we have only strong push left upwards from current low which should come either as a straight impulse or an expanding diagonal which will be extremely annoying.

免責聲明
這些資訊和出版物並非旨在提供,也不構成TradingView提供或認可的任何形式的財務、投資、交易或其他類型的建議或推薦。請閱讀使用條款以了解更多資訊。