
hello everybody.
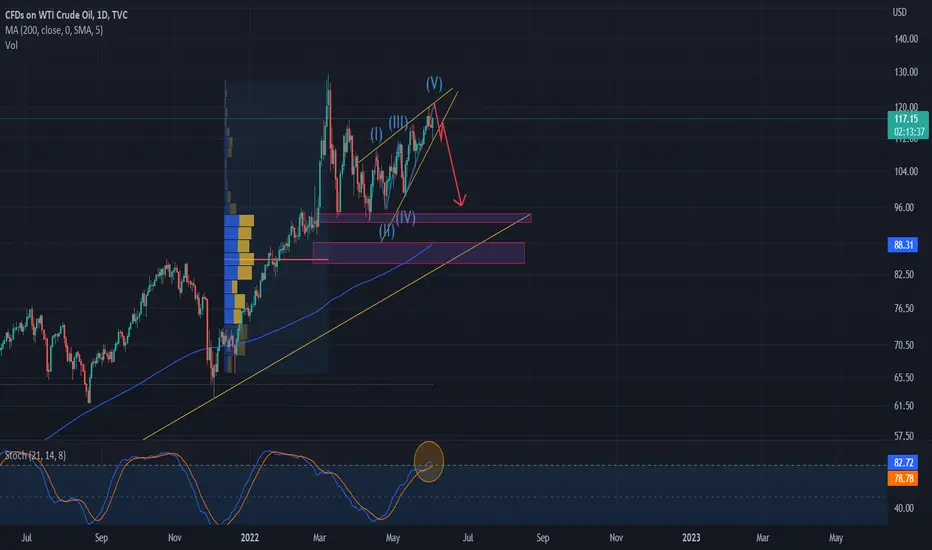
according to the technical analyze we can see the terminal trend in US oil.
and i think the trend in 1D timeframe become weak and i see a correction potential for that.
after we break out of disjoint channel that i draw on my chart we could have a pullback and after that
go down.
the first target for swing traders is around 93 94
and we can see a strengh support around 85-90 area like i illustrate in chart.
PCC(point of control)is in this area and we have the MA200 here too.
in addition longterm trendline is around this condition.
so we have 3 important levels and support in this area (85-90).
our momentum is in overbought level and going downward.
dont forget to put stoploss above the last major high.
(NOTE:friends this is my personal opinion and its not a trade suggestion.
please analyze in your own strategy and help me be better)
thank you all.
交易結束:目標達成
after about 40 days that i share this idea (we are in 122$)WTI reache the first support at 95$
hope you used this opportunity.

免責聲明
這些資訊和出版物並非旨在提供,也不構成TradingView提供或認可的任何形式的財務、投資、交易或其他類型的建議或推薦。請閱讀使用條款以了解更多資訊。
免責聲明
這些資訊和出版物並非旨在提供,也不構成TradingView提供或認可的任何形式的財務、投資、交易或其他類型的建議或推薦。請閱讀使用條款以了解更多資訊。