
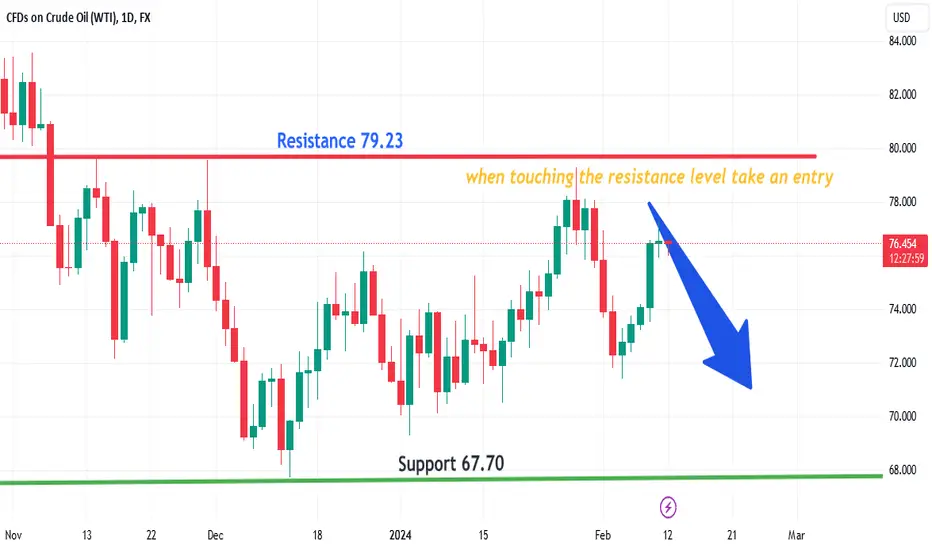
🚨 Crude Oil #WTI
🗓️ Date: 12 February, 2024
⏰ Timeframe: Daily
💡 Given in the chart –
♦️ Green (long term support) = 67.50
♦️ Red (resistance) = 78.85
The price has been in the range (red color) on the chart since December last year. Price touched this range several times but failed to deliver a breakout. As long as this range remains active, the potential trend will be neutral.
✅ Those who like to trade in Crude Oil, please take Buy position near the support level of the range and Sell position near the resistance level. That is, bounce trading strategy
✅ As long as the price is not able to break this range, you can accept entries according to this pattern.
🚫 Remember, while staying within the range, no Buy/Sell entry can be taken in intermediate positions. Either let the price approach the resistance level or the support level, then take a reversal entry.

免責聲明
這些資訊和出版物並非旨在提供,也不構成TradingView提供或認可的任何形式的財務、投資、交易或其他類型的建議或推薦。請閱讀使用條款以了解更多資訊。
免責聲明
這些資訊和出版物並非旨在提供,也不構成TradingView提供或認可的任何形式的財務、投資、交易或其他類型的建議或推薦。請閱讀使用條款以了解更多資訊。