
Hi, this is my first post.
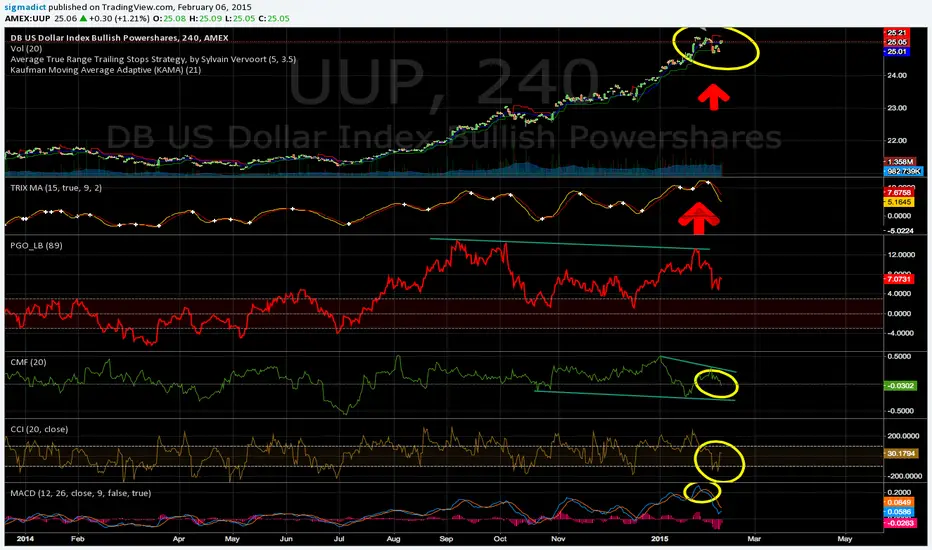
Sharing my view of US Dollar Index DXY threw UUP, where options can be trade.
I would suggest to be careful entering long at this point because of the followings:
1-Weekly chart Hanging Man (signal potential reverse of bullish trend)
2-ATR signalling we might be reversing trend in 4H chart (top yellow circle)
3-MACD lines crossed on 4H chart , also on Daily and 2Days
4-CMF divergence in 4H and is under zero (negative flow), Weekly chart CMF = 0.48, with maximum value of 0.50, Weekly MFI = 83.6 (overbought signal)
5-RSI Weekly chart at 81.2 (overbought signal)
6-Monthly chart touched RSI_BAND top band (overbought signal)
7-CCI touched (-100) + (potential reverse signal of momentum)
8-Stochastics Monthly chart is in overbought territory
9-We are at resistance
10-The look of this chart (personal)
Feel free to comment on my analysis.
Enjoy !
Sharing my view of US Dollar Index DXY threw UUP, where options can be trade.
I would suggest to be careful entering long at this point because of the followings:
1-Weekly chart Hanging Man (signal potential reverse of bullish trend)
2-ATR signalling we might be reversing trend in 4H chart (top yellow circle)
3-MACD lines crossed on 4H chart , also on Daily and 2Days
4-CMF divergence in 4H and is under zero (negative flow), Weekly chart CMF = 0.48, with maximum value of 0.50, Weekly MFI = 83.6 (overbought signal)
5-RSI Weekly chart at 81.2 (overbought signal)
6-Monthly chart touched RSI_BAND top band (overbought signal)
7-CCI touched (-100) + (potential reverse signal of momentum)
8-Stochastics Monthly chart is in overbought territory
9-We are at resistance
10-The look of this chart (personal)
Feel free to comment on my analysis.
Enjoy !

免責聲明
這些資訊和出版物並非旨在提供,也不構成TradingView提供或認可的任何形式的財務、投資、交易或其他類型的建議或推薦。請閱讀使用條款以了解更多資訊。