
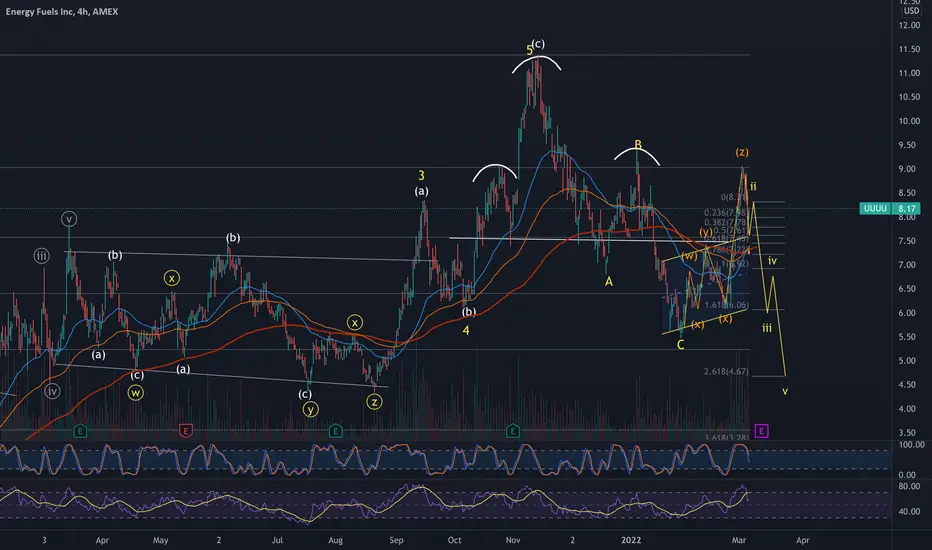
looks like my Z wave is playing out for the UUUU here, to understand WXYXZ pattern is to know that a series of 3-3-3-3-3 wave patterns have evolved and they are sideways in the chart not compressed into a triangle which would rule the 3 wave pattern as an ABCDE. Now looking at the stoch RSI and also the standard RSI we can see they are both dropping from over bought with room to drop, also the daily rsi has much room. If the Z wave ends up in typical Z wave fashion it would look like the start of an impulse but is actually the end of the WXYXZ pattern and shows all bullish momo has finished . So if I'm correct we are in W2 on H4 and the daily should hit 1.618 fib lvl for a W3 around $4.70 to confirm my chart.

If your interested in joining my group DM me for the link. We do Elliot Wave TA give trade signals and set ups. We have channels for all cryptocurrency and also many OTC stocks. TY
免責聲明
這些資訊和出版物並非旨在提供,也不構成TradingView提供或認可的任何形式的財務、投資、交易或其他類型的建議或推薦。請閱讀使用條款以了解更多資訊。
If your interested in joining my group DM me for the link. We do Elliot Wave TA give trade signals and set ups. We have channels for all cryptocurrency and also many OTC stocks. TY
免責聲明
這些資訊和出版物並非旨在提供,也不構成TradingView提供或認可的任何形式的財務、投資、交易或其他類型的建議或推薦。請閱讀使用條款以了解更多資訊。