
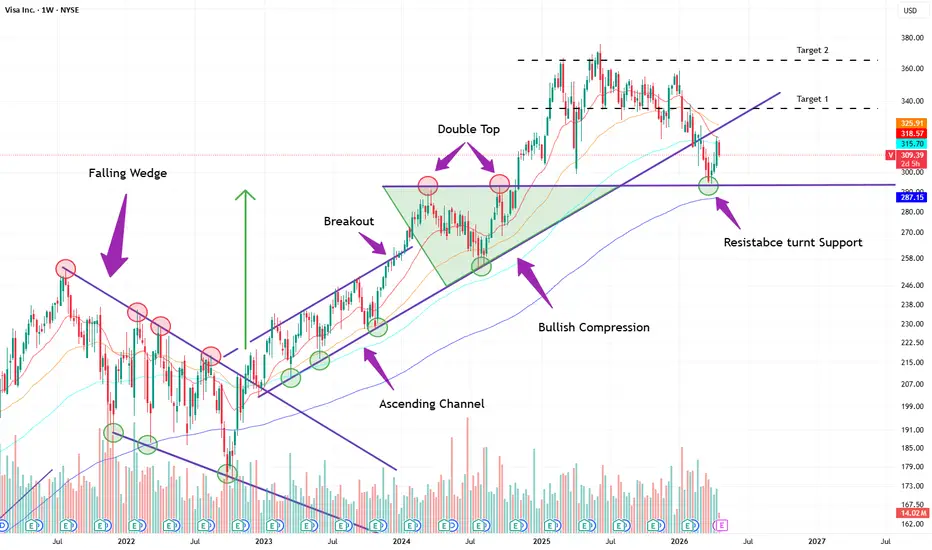
VISA (V) - Resistance Turned Support After Multi-Year Pattern Completion
Timeframe: 1-Week | Bias: Bullish
THE TECHNICAL STORY
What you're looking at on Visa is a textbook multi-year pattern sequence that has been playing out with remarkable precision since the 2022 bear market lows.
Stage 1 - Falling Wedge (2021-2022)
The bear market decline formed a clean falling wedge with lower highs and lower lows converging toward a tight apex. The red circles marking the highs and the green circles marking the lows show the compression perfectly. This is a classically bullish reversal pattern (the tighter the wedge, the more explosive the eventual breakout.).
Stage 2 - Breakout & Ascending Channel (Late 2022-2024)
December 2022 marked the inflection point. Price broke decisively above the falling wedge with a strong momentum candle, confirmed by the volume surge visible at the base. What followed was an ordered ascending channel (a series of higher highs and higher lows) respecting both the upper and lower trendlines cleanly. The green circles along the channel lows show each successful retest of support.
Stage 3 - Bullish Compression (Mid 2024)
Inside the ascending channel, price formed a bullish compression triangle (higher lows converging toward the key $300 horizontal resistance level). This pattern indicates accumulation with buyers becoming increasingly aggressive at each dip. The triangle resolved with a breakout to the upside, launching price toward the double top zone.
Stage 4 - Double Top (Late 2024-Early 2025)
Price reached the $360-370 zone twice, forming a double top. Both peaks were rejected at the same level, marked by the red circles, with declining momentum on the second attempt. The neckline at $300 horizontal support became the critical level to watch.
Stage 5 - Resistance Turned Support (Current)
This is the most important part of the chart right now. After the double top resolved with a pullback, price has returned to the $300 zone, which was previously the major resistance level going back to 2024. Classic technical analysis teaches that broken resistance becomes support, and that is precisely what appears to be happening. The green circle at the current price zone (~$309) shows price bouncing from this level with conviction.
THE BULL CASE
Two layers of support are converging at $295-305:
The $300 horizontal - former resistance, now support
The 200-period moving average (on the 1W chart)
Dual confluence at a key level after a healthy correction from the double top highs is one of the more reliable setups in technical analysis.
Target 1: $341 - the horizontal level visible on the right side of the chart, and the current price marker
Target 2: $360-370 - retest of the double top highs
Target 3: $400+ - measured move from the ascending channel breakout
THE BEAR CASE
A breach of the channel lower trendline would invalidate the bull thesis entirely.
Invalidation: Daily close below $292
CONCLUSION
Visa has built a multi-year technical foundation through a falling wedge, ascending channel, and bullish compression. The double top created a healthy correction that has created a solid price support zone. As long as $295-300 holds, the path of least resistance is higher. The current resistance-turned-support test is the pivotal moment, and so far, the bulls are defending it.
Our preferred confirmation will be price holding above the support and a bullish crossover of MACD over the Signal

Not financial advice. Technical analysis does not guarantee future performance.
If you enjoyed reading our idea please boost and follow to not miss any future publishments 🚀🚀🚀
Timeframe: 1-Week | Bias: Bullish
THE TECHNICAL STORY
What you're looking at on Visa is a textbook multi-year pattern sequence that has been playing out with remarkable precision since the 2022 bear market lows.
Stage 1 - Falling Wedge (2021-2022)
The bear market decline formed a clean falling wedge with lower highs and lower lows converging toward a tight apex. The red circles marking the highs and the green circles marking the lows show the compression perfectly. This is a classically bullish reversal pattern (the tighter the wedge, the more explosive the eventual breakout.).
Stage 2 - Breakout & Ascending Channel (Late 2022-2024)
December 2022 marked the inflection point. Price broke decisively above the falling wedge with a strong momentum candle, confirmed by the volume surge visible at the base. What followed was an ordered ascending channel (a series of higher highs and higher lows) respecting both the upper and lower trendlines cleanly. The green circles along the channel lows show each successful retest of support.
Stage 3 - Bullish Compression (Mid 2024)
Inside the ascending channel, price formed a bullish compression triangle (higher lows converging toward the key $300 horizontal resistance level). This pattern indicates accumulation with buyers becoming increasingly aggressive at each dip. The triangle resolved with a breakout to the upside, launching price toward the double top zone.
Stage 4 - Double Top (Late 2024-Early 2025)
Price reached the $360-370 zone twice, forming a double top. Both peaks were rejected at the same level, marked by the red circles, with declining momentum on the second attempt. The neckline at $300 horizontal support became the critical level to watch.
Stage 5 - Resistance Turned Support (Current)
This is the most important part of the chart right now. After the double top resolved with a pullback, price has returned to the $300 zone, which was previously the major resistance level going back to 2024. Classic technical analysis teaches that broken resistance becomes support, and that is precisely what appears to be happening. The green circle at the current price zone (~$309) shows price bouncing from this level with conviction.
THE BULL CASE
Two layers of support are converging at $295-305:
The $300 horizontal - former resistance, now support
The 200-period moving average (on the 1W chart)
Dual confluence at a key level after a healthy correction from the double top highs is one of the more reliable setups in technical analysis.
Target 1: $341 - the horizontal level visible on the right side of the chart, and the current price marker
Target 2: $360-370 - retest of the double top highs
Target 3: $400+ - measured move from the ascending channel breakout
THE BEAR CASE
A breach of the channel lower trendline would invalidate the bull thesis entirely.
Invalidation: Daily close below $292
CONCLUSION
Visa has built a multi-year technical foundation through a falling wedge, ascending channel, and bullish compression. The double top created a healthy correction that has created a solid price support zone. As long as $295-300 holds, the path of least resistance is higher. The current resistance-turned-support test is the pivotal moment, and so far, the bulls are defending it.
Our preferred confirmation will be price holding above the support and a bullish crossover of MACD over the Signal
Not financial advice. Technical analysis does not guarantee future performance.
If you enjoyed reading our idea please boost and follow to not miss any future publishments 🚀🚀🚀
註釋
Amazing Earnings Report!!!
Vassilis Kairaktidis
Initium Asset Management
Initium Asset Management
免責聲明
這些資訊和出版物並非旨在提供,也不構成TradingView提供或認可的任何形式的財務、投資、交易或其他類型的建議或推薦。請閱讀使用條款以了解更多資訊。
Vassilis Kairaktidis
Initium Asset Management
Initium Asset Management
免責聲明
這些資訊和出版物並非旨在提供,也不構成TradingView提供或認可的任何形式的財務、投資、交易或其他類型的建議或推薦。請閱讀使用條款以了解更多資訊。