Long
VIBE Token Reversal Potential
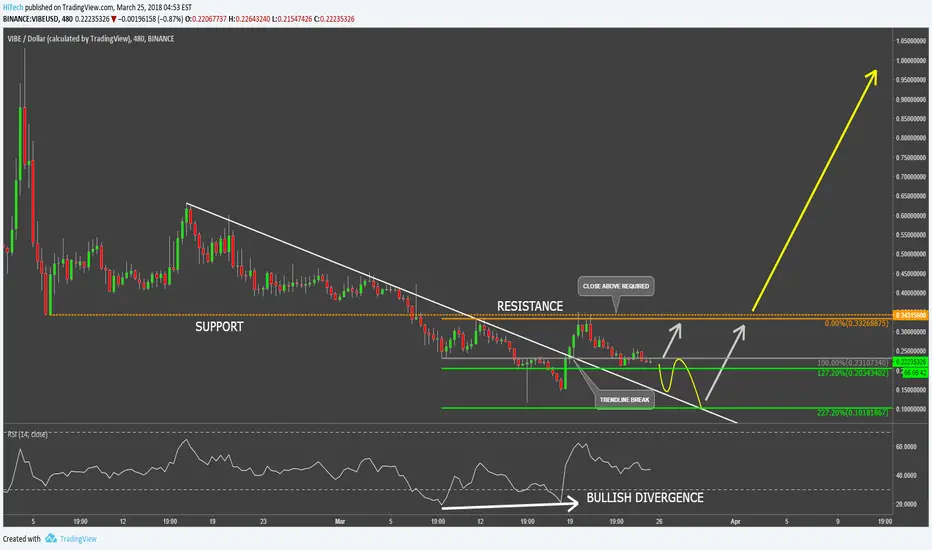
VIBE has experienced a continuous downtrend since inception, but the current price action shows signs of the potential reversal of the trend. VIBE/USD has reached an all-time low on the 15th of March while hitting $0.115. The RSI oscillator formed a bullish divergence and price managed to break above the downtrend trendline.
Although the previous support at $0.35 is now acting as a resistance that has been rejected twise. In order for VIBE to start an uptrend, a daily close above that resistance is required.
On a downside, if the resistance will continue to be respected, more consolidation could take place sending price to 227.2% Fibonacci support at $0.1 psychological round number.
Although the previous support at $0.35 is now acting as a resistance that has been rejected twise. In order for VIBE to start an uptrend, a daily close above that resistance is required.
On a downside, if the resistance will continue to be respected, more consolidation could take place sending price to 227.2% Fibonacci support at $0.1 psychological round number.
交易結束:目標達成

免責聲明
這些資訊和出版物並非旨在提供,也不構成TradingView提供或認可的任何形式的財務、投資、交易或其他類型的建議或推薦。請閱讀使用條款以了解更多資訊。
免責聲明
這些資訊和出版物並非旨在提供,也不構成TradingView提供或認可的任何形式的財務、投資、交易或其他類型的建議或推薦。請閱讀使用條款以了解更多資訊。