
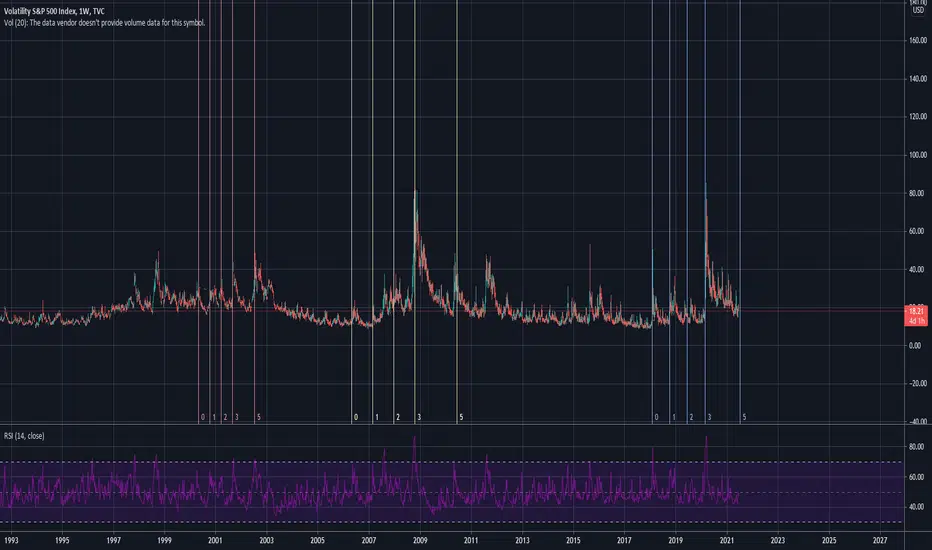
Vix has been consolidating for a while, making my options relatively cheap to buy.
I generally discount the fib time zone tool because it is entirely dependent on how it's drawn. It is easy to fall prey into drawing to fit the pattern after the fact and therefore very prone to being a subjective tool.
But this is at least interesting to draw to get a sense of rough price timing, especially with VIX since its precise magnitude doesn't matter.
Drawing the 0->1 between the first two peaks of the first two parabolic highs after a long consolidation gives the following pattern:
0: Peak
1: Peak
2: not interesting enough
3: Peak
5: Peak
any time zone beyond this figure is too crazy to even attempt (if timing the market is that easy we'd all be rich).
///
Never use this tool to make a decision.
That being said, it's interesting to look at and gives a broad perspective that volatility may be close to finishing its consolidation pattern in the coming months. Eyes peeled now.
I generally discount the fib time zone tool because it is entirely dependent on how it's drawn. It is easy to fall prey into drawing to fit the pattern after the fact and therefore very prone to being a subjective tool.
But this is at least interesting to draw to get a sense of rough price timing, especially with VIX since its precise magnitude doesn't matter.
Drawing the 0->1 between the first two peaks of the first two parabolic highs after a long consolidation gives the following pattern:
0: Peak
1: Peak
2: not interesting enough
3: Peak
5: Peak
any time zone beyond this figure is too crazy to even attempt (if timing the market is that easy we'd all be rich).
///
Never use this tool to make a decision.
That being said, it's interesting to look at and gives a broad perspective that volatility may be close to finishing its consolidation pattern in the coming months. Eyes peeled now.

免責聲明
這些資訊和出版物並非旨在提供,也不構成TradingView提供或認可的任何形式的財務、投資、交易或其他類型的建議或推薦。請閱讀使用條款以了解更多資訊。
免責聲明
這些資訊和出版物並非旨在提供,也不構成TradingView提供或認可的任何形式的財務、投資、交易或其他類型的建議或推薦。請閱讀使用條款以了解更多資訊。