
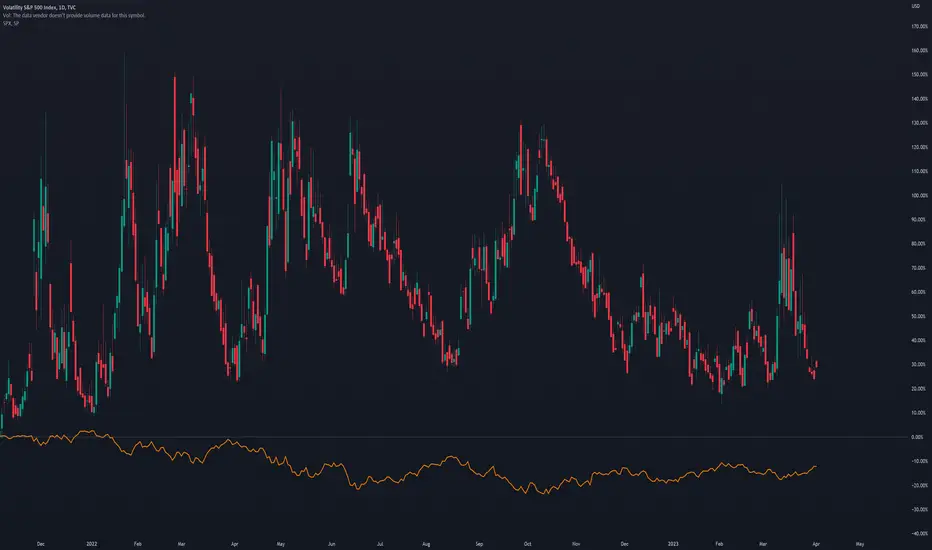
The Volatility S&P 500 Index rose slightly today, following a short period with a relatively low value. As is displayed on the chart, within the past year, these moments often coincided with tops in SPX and preceded times of increased volatility with significant selling pressure. Therefore, we will monitor this metric closely in the following days.
*The orange line represents SPX.
Please feel free to express your ideas and thoughts in the comment section.
DISCLAIMER: This analysis is not intended to encourage any buying or selling of any particular securities. Furthermore, it should not be a basis for taking any trade action by an individual investor. Therefore, your own due diligence is highly advised before entering a trade.
交易進行
VIX is hitting 15-month lows, a big warning.
免責聲明
這些資訊和出版物並非旨在提供,也不構成TradingView提供或認可的任何形式的財務、投資、交易或其他類型的建議或推薦。請閱讀使用條款以了解更多資訊。