搜尋
產品
社群
市場
經紀商
更多
TW
立即開始
S&P 500波動率指數
2023年4月12日
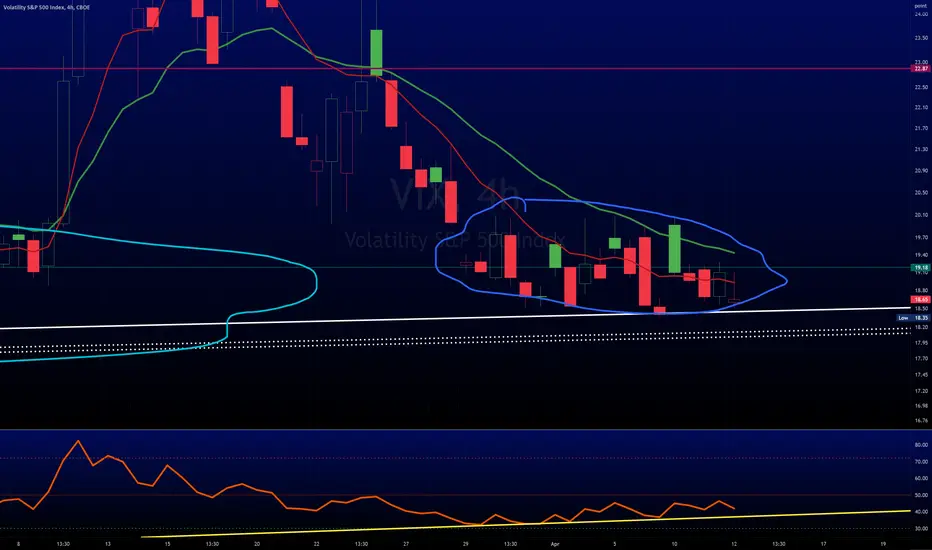
$VIX forming positive divergence while $SPX forms negative
2
取得這個圖表
150
April has been positive, in fact the BEST MONTH, 16 of last 20 years & has an avg 2.5%!
The orange line coincidentally is around 2.5%!
We've sold
VIX
puts further out into May :)
Have a ton of $ reserved for that trade.
Easier 2c neg divergence on 4Hr vs positive on
VIX
#stocks
ROW_Partners
關注
正在關注
此外:
Chart Patterns
Technical Indicators
SPX (S&P 500 Index)
SPDR S&P 500 ETF (SPY)
Stocks
Trend Analysis
VIX CBOE Volatility Index
相關出版品
$VIX @ lower level & indices closing in to MAJOR RESISTANCE
由ROW_Partners提供
免責聲明
這些資訊和出版物並非旨在提供,也不構成TradingView提供或認可的任何形式的財務、投資、交易或其他類型的建議或推薦。請閱讀
使用條款
以了解更多資訊。
Chart Patterns
Technical Indicators
SPX (S&P 500 Index)
SPDR S&P 500 ETF (SPY)
Stocks
Trend Analysis
VIX CBOE Volatility Index
ROW_Partners
關注
正在關注
此外:
相關出版品
$VIX @ lower level & indices closing in to MAJOR RESISTANCE
由ROW_Partners提供
免責聲明
這些資訊和出版物並非旨在提供,也不構成TradingView提供或認可的任何形式的財務、投資、交易或其他類型的建議或推薦。請閱讀
使用條款
以了解更多資訊。