
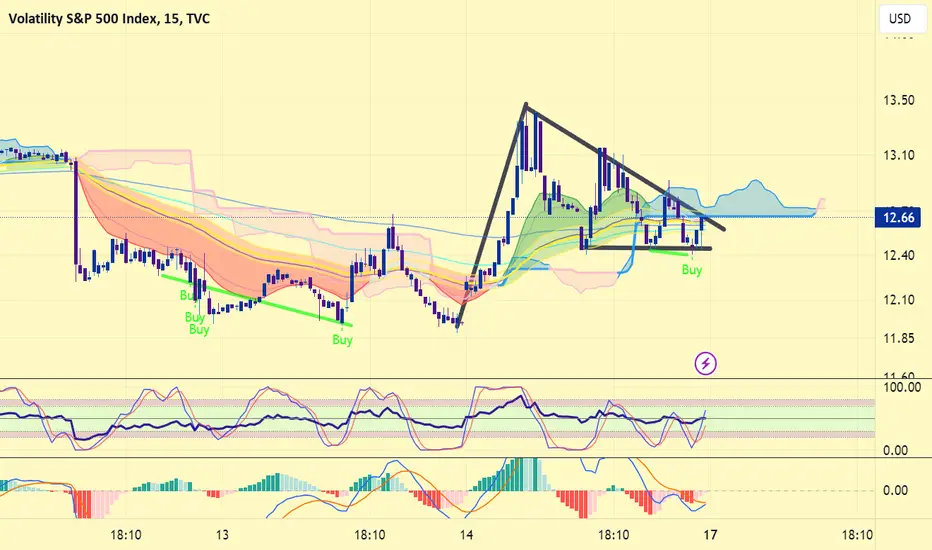
#vix volatility index chart made double bottom and W bounced. The bullish movement will likely continue even more while the chart made bullish flag in lower time frame.
Also recent days #dxy dollar index chart made a bullish breakout and while VIX and DXY are both getting stronger, this will not likely be good for #btc #altcoins #stocks etc. I think something is cooking... Better not to be over greedy. Not financial advice.
Also recent days #dxy dollar index chart made a bullish breakout and while VIX and
DXY are both getting stronger, this will not likely be good for #btc #altcoins #stocks etc. I think something is cooking... Better not to be over greedy. Not financial advice.
免責聲明
這些資訊和出版物並非旨在提供,也不構成TradingView提供或認可的任何形式的財務、投資、交易或其他類型的建議或推薦。請閱讀使用條款以了解更多資訊。