
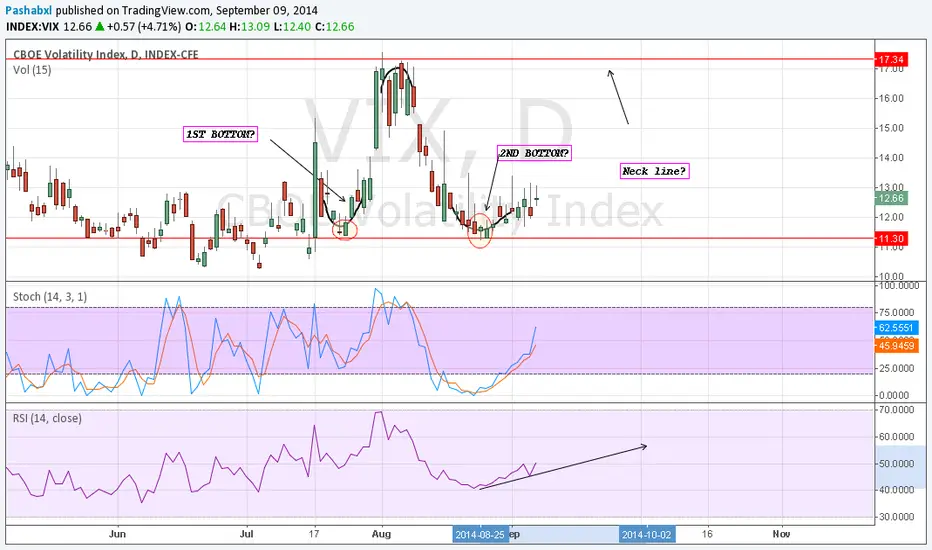
On a purely chartist approach, VIX is about the make a double bottom, which is that case would make 17.35 the neck line and after a pull back over 17.35 toward 20+
This has to be confirmed of course.
On the other hand, with the tappering the end of FED's QE3, there may much more volatility in the market because traders will be on there own.....
Let's wait and see
This has to be confirmed of course.
On the other hand, with the tappering the end of FED's QE3, there may much more volatility in the market because traders will be on there own.....
Let's wait and see

相關出版品
免責聲明
這些資訊和出版物並非旨在提供,也不構成TradingView提供或認可的任何形式的財務、投資、交易或其他類型的建議或推薦。請閱讀使用條款以了解更多資訊。