
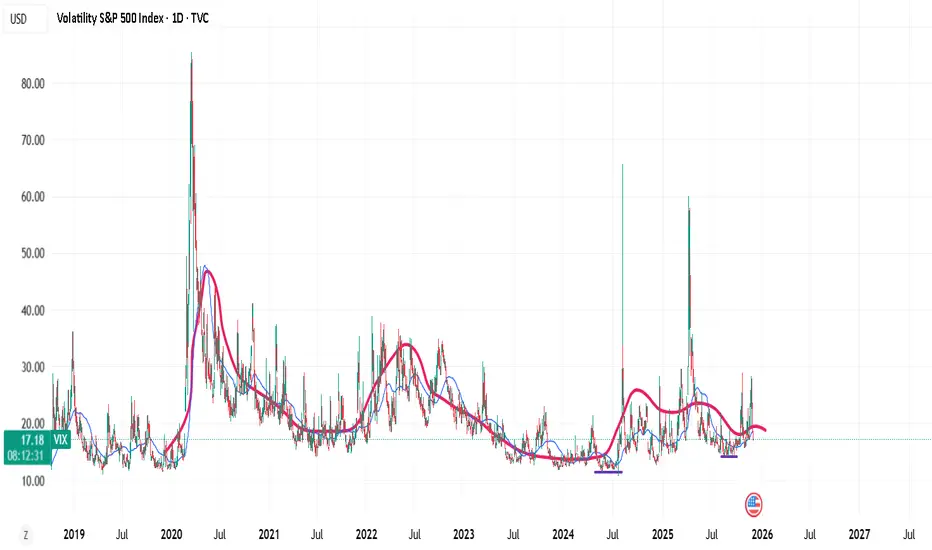
"high volatility is often followed by high volatility (and low by low) rather than being randomly distributed"
Markets move in cycles. Using this principle you could some times predict outcomes (regime changes).
Markets move in cycles. Using this principle you could some times predict outcomes (regime changes).
註釋
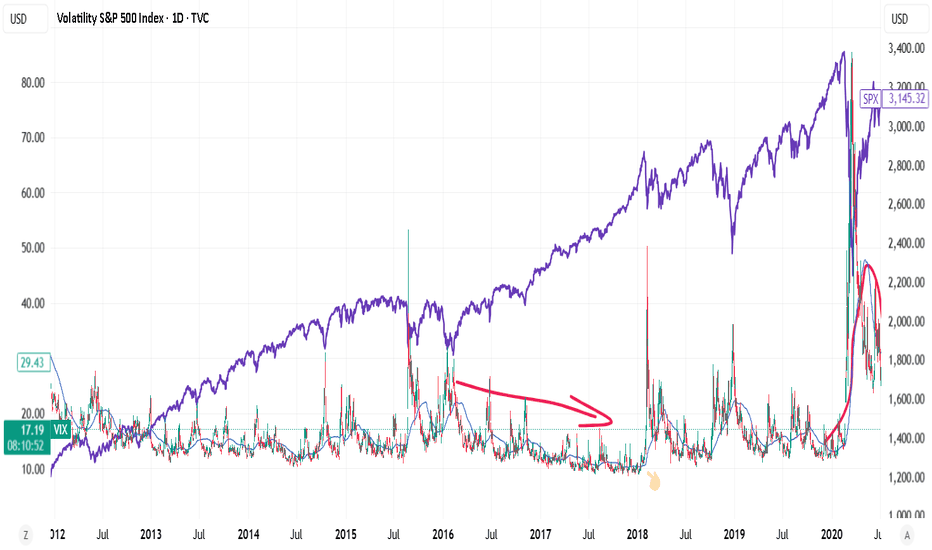
Highest risk should be where volatility has been downtrading for long time and is passive. Meaning stock market has strong demand and trend. And there are high expectations.
Low volatility is followed by high volatility regime.
//Maybe this is out of context, but these patterns repeat historically.
註釋
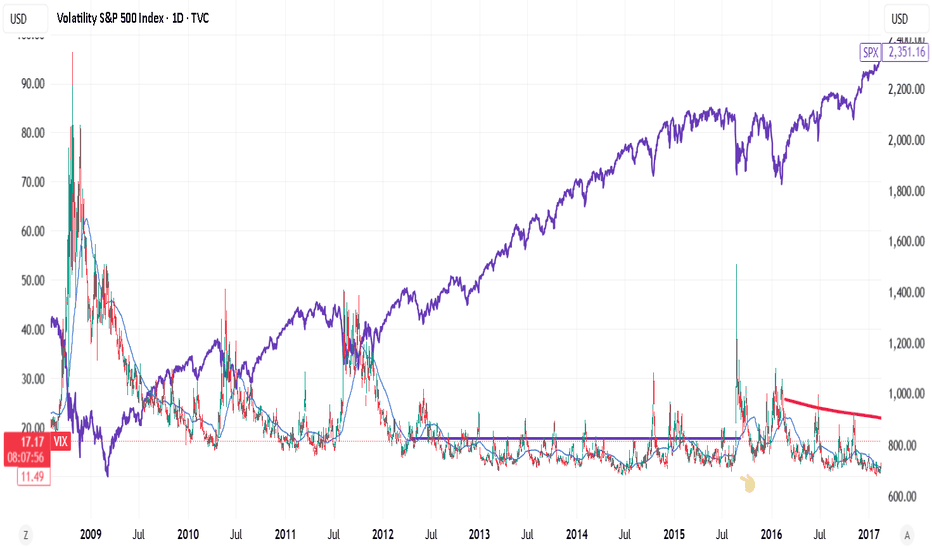
Long low volatility market. Followed by high volatility. And Price in relative terms.
註釋
Low relative price + HIGH volatility period ---> good opportunity long term?HIGH relative price + LOW volatility period ---> big risk?
註釋
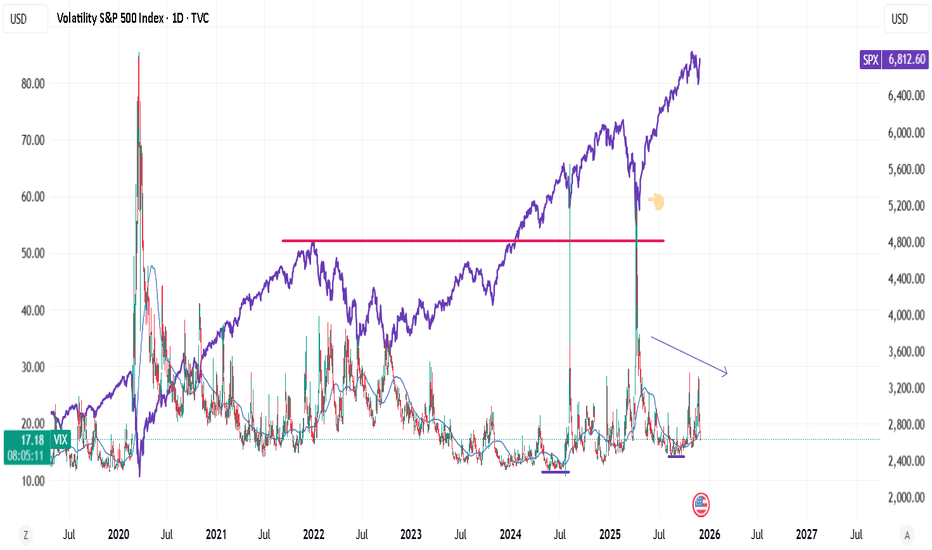
Low relative price + High volatility ---> opportunity. Panic sentiment
註釋
Strong markets ---> choppy markets (better or worse). --> strong
免責聲明
這些資訊和出版物並非旨在提供,也不構成TradingView提供或認可的任何形式的財務、投資、交易或其他類型的建議或推薦。請閱讀使用條款以了解更多資訊。