
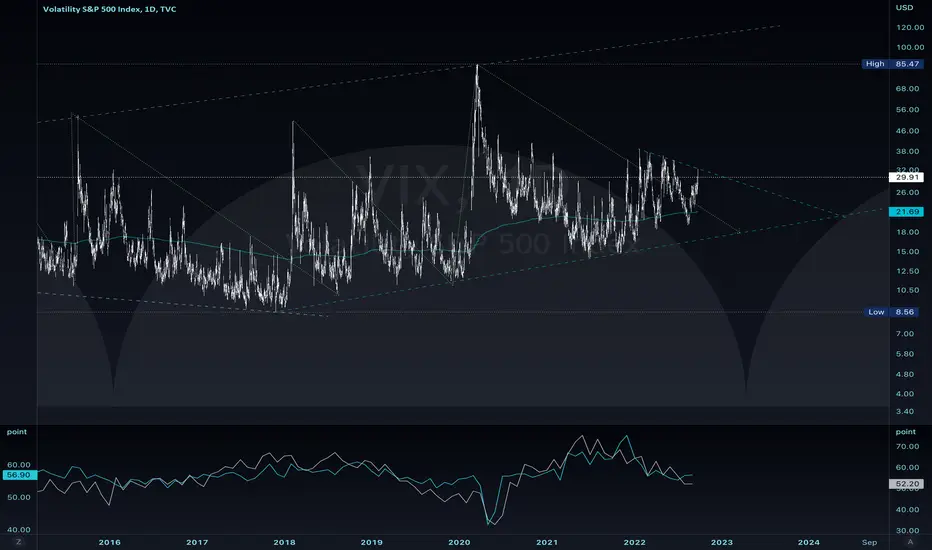
A macro view of VIX versus US Manufacturing and Non-Manufacturing PMI's with a visual aid for base time cycles.
Taking note without special emphasis of the 200 Week EMA of the VIX, which may be utilized as a confirming indicator a period of continued elevated volatility.
Chart is intended as a simple visual aid for contraction and expansion periods in the US economy.
Taking note without special emphasis of the 200 Week EMA of the VIX, which may be utilized as a confirming indicator a period of continued elevated volatility.
Chart is intended as a simple visual aid for contraction and expansion periods in the US economy.

免責聲明
這些資訊和出版物並非旨在提供,也不構成TradingView提供或認可的任何形式的財務、投資、交易或其他類型的建議或推薦。請閱讀使用條款以了解更多資訊。