
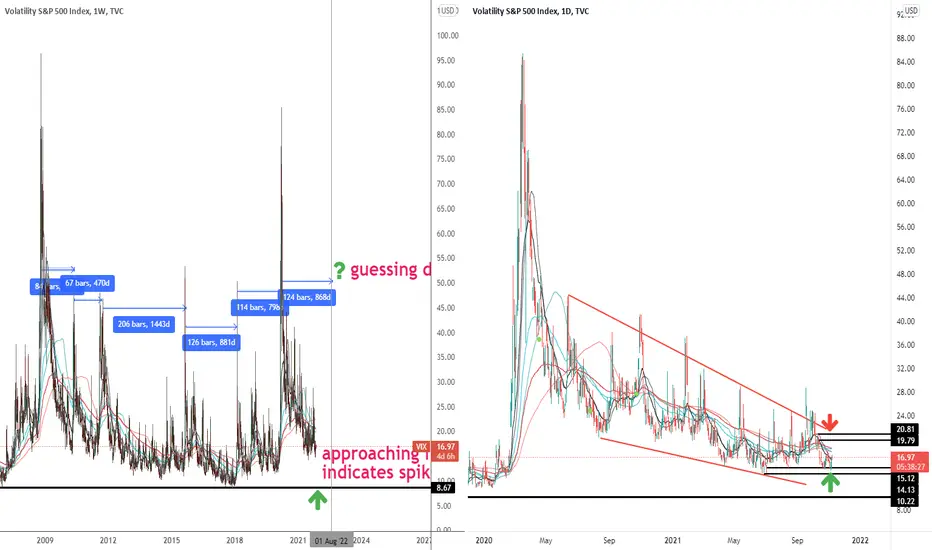
Hello everyone. VIX just caught my eye for its floor level of 8.67 on the weekly chart. I applied measured move to guess when the spike might happen roughly. Guess what? It's Aug. next year.
Don't take it too serious, nobody knows what will happen then. By measuring the date between the spikes on the weekly chart, I started to realize no matter what things will happen from time to time, especially VIX is running at low, say around or below 10.
It's like a cycle. All my MAs on the daily is going down and the red downtrend lines were well respected. It will support the market to be bullish until VIX couldn't go any lower. It has to rally from the down, terminating the old cycle and starting a new one.
What do you think of my chart? Any ideas?
Don't take it too serious, nobody knows what will happen then. By measuring the date between the spikes on the weekly chart, I started to realize no matter what things will happen from time to time, especially VIX is running at low, say around or below 10.
It's like a cycle. All my MAs on the daily is going down and the red downtrend lines were well respected. It will support the market to be bullish until VIX couldn't go any lower. It has to rally from the down, terminating the old cycle and starting a new one.
What do you think of my chart? Any ideas?

plan your trade and trade your plan
免責聲明
這些資訊和出版物並非旨在提供,也不構成TradingView提供或認可的任何形式的財務、投資、交易或其他類型的建議或推薦。請閱讀使用條款以了解更多資訊。
plan your trade and trade your plan
免責聲明
這些資訊和出版物並非旨在提供,也不構成TradingView提供或認可的任何形式的財務、投資、交易或其他類型的建議或推薦。請閱讀使用條款以了解更多資訊。