
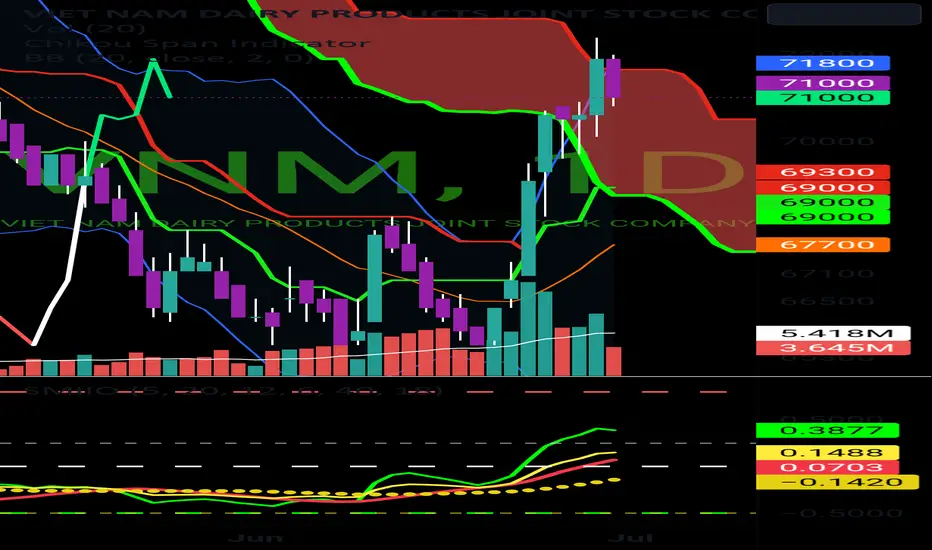
import pandas as pd
import ta.volatility as vol
# Load stock price data into a pandas DataFrame
df = pd.read_csv('stock_prices.csv')
# Calculate Bollinger Bands
df['bb_high'], df['bb_mid'], df['bb_low'] = vol.bollinger_hband(df['Close']), vol.bollinger_mavg(df['Close']), vol.bollinger_lband(df['Close'])
# Filter stock price movements that are above the upper Bollinger Band
df['above_bb_high'] = df['Close'] > df['bb_high']
# Filter stock price movements that are below the lower Bollinger Band
df['below_bb_low'] = df['Close'] < df['bb_low']
# Print the filtered stock price movements
print(df[df['above_bb_high'] | df['below_bb_low']])
import ta.volatility as vol
# Load stock price data into a pandas DataFrame
df = pd.read_csv('stock_prices.csv')
# Calculate Bollinger Bands
df['bb_high'], df['bb_mid'], df['bb_low'] = vol.bollinger_hband(df['Close']), vol.bollinger_mavg(df['Close']), vol.bollinger_lband(df['Close'])
# Filter stock price movements that are above the upper Bollinger Band
df['above_bb_high'] = df['Close'] > df['bb_high']
# Filter stock price movements that are below the lower Bollinger Band
df['below_bb_low'] = df['Close'] < df['bb_low']
# Print the filtered stock price movements
print(df[df['above_bb_high'] | df['below_bb_low']])

免責聲明
這些資訊和出版物並非旨在提供,也不構成TradingView提供或認可的任何形式的財務、投資、交易或其他類型的建議或推薦。請閱讀使用條款以了解更多資訊。
免責聲明
這些資訊和出版物並非旨在提供,也不構成TradingView提供或認可的任何形式的財務、投資、交易或其他類型的建議或推薦。請閱讀使用條款以了解更多資訊。