
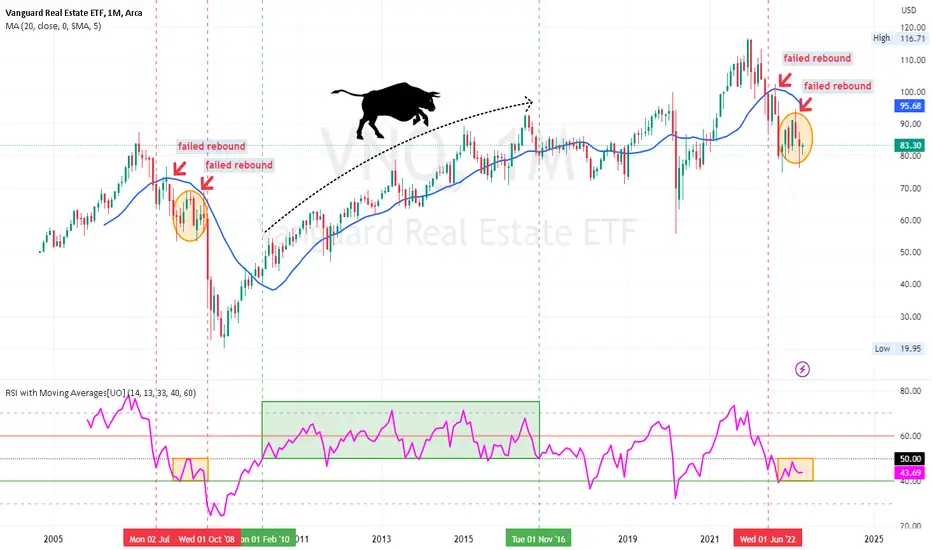
Back then:
VNQ falls below 20 SMA in Jul 2007
Double attempt to rebound (red arrows) but failed
after struggling 15 months, a sell off begin in Oct 2008
Now:
VNQ falls below 20 SMA in Jun 2022
Double attempt to rebound (red arrows) but failed
RSI remained in low levels below 50 (more bearish than bullish)
Might not seen the worst yet, unless RSI reverse back above 50
VNQ falls below 20 SMA in Jul 2007
Double attempt to rebound (red arrows) but failed
after struggling 15 months, a sell off begin in Oct 2008
Now:
VNQ falls below 20 SMA in Jun 2022
Double attempt to rebound (red arrows) but failed
RSI remained in low levels below 50 (more bearish than bullish)
Might not seen the worst yet, unless RSI reverse back above 50

免責聲明
這些資訊和出版物並非旨在提供,也不構成TradingView提供或認可的任何形式的財務、投資、交易或其他類型的建議或推薦。請閱讀使用條款以了解更多資訊。