搜尋
產品
社群
市場
經紀商
更多
TW
立即開始
Cboe Volatility Index (VIX) Futures
2024年8月9日
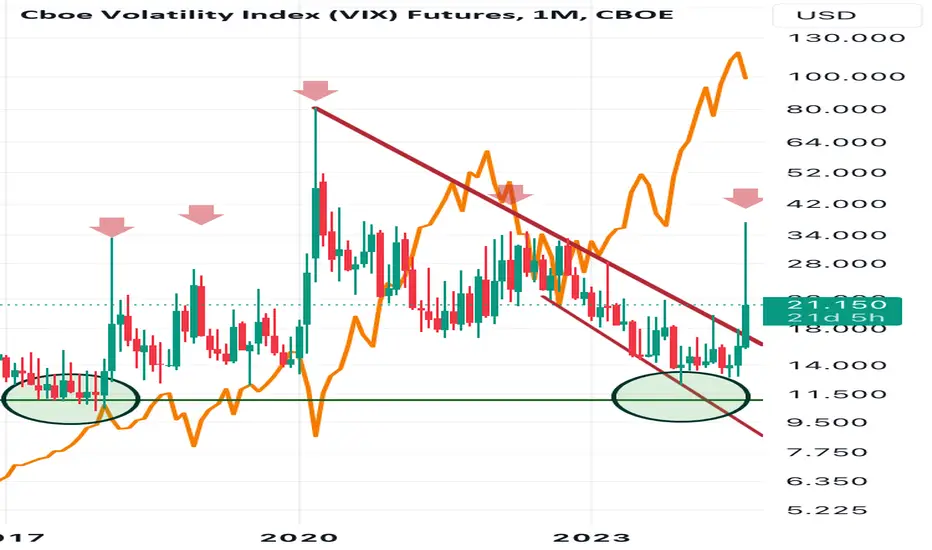
VIX vs SPX monthly
0
取得這個圖表
2
149
VIX vs SPX, monthly chart.
Large spikes after a sustained and controlled downside wedge end up with big crashes on the stock index
j_arrieta
關注
正在關注
此外:
Chart Patterns
Technical Indicators
SPX (S&P 500 Index)
S&P 500 (SPX500)
Trend Analysis
VIX CBOE Volatility Index
相關出版品
5000 for SPX
由j_arrieta提供
SPX, wave 4 correction
由j_arrieta提供
SPX weekly Ichimoku cloud
由j_arrieta提供
SPX daily Ichimoku Cloud
由j_arrieta提供
VIX breaking the wedge
由j_arrieta提供
免責聲明
這些資訊和出版物並非旨在提供,也不構成TradingView提供或認可的任何形式的財務、投資、交易或其他類型的建議或推薦。請閱讀
使用條款
以了解更多資訊。
Chart Patterns
Technical Indicators
SPX (S&P 500 Index)
S&P 500 (SPX500)
Trend Analysis
VIX CBOE Volatility Index
j_arrieta
關注
正在關注
此外:
相關出版品
5000 for SPX
由j_arrieta提供
SPX, wave 4 correction
由j_arrieta提供
SPX weekly Ichimoku cloud
由j_arrieta提供
SPX daily Ichimoku Cloud
由j_arrieta提供
VIX breaking the wedge
由j_arrieta提供
免責聲明
這些資訊和出版物並非旨在提供,也不構成TradingView提供或認可的任何形式的財務、投資、交易或其他類型的建議或推薦。請閱讀
使用條款
以了解更多資訊。