做多
WAVES-BTC Trade Idea
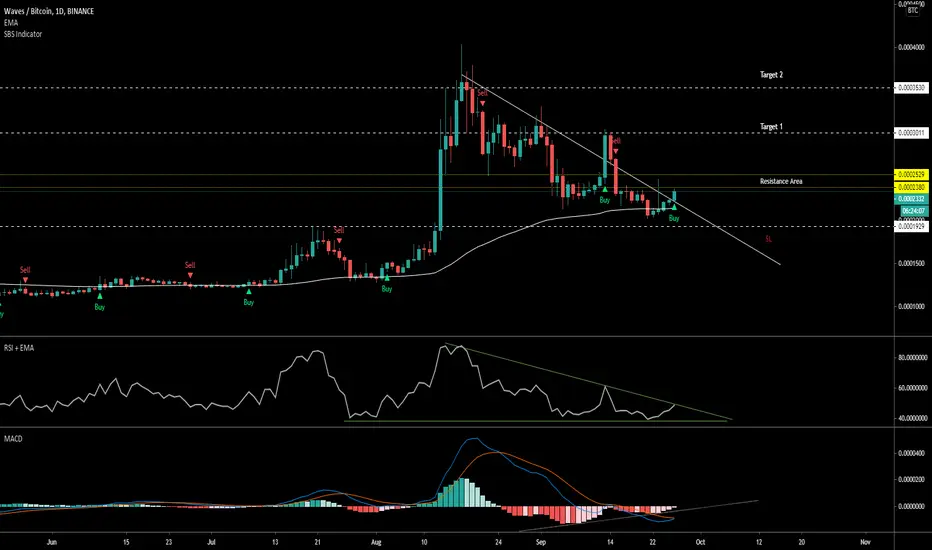
WAVES is breaking out of the trend Line on Daily TF
There is small resistance (Yellow Line) at the Breakout. Break out with good volume will reach Target 1
EMA 89 is acting as a support.
RSI is rising and breakout of the trendline which is acting a diagonal resistance.
MACD is about to cross bullish on Daily chart
MACD histogram is showing Bullish Divergence
SBS Indicator is signaling BUY on Daily chart
Target and SL are on the chart.
Lets see how this plays out.
交易結束:目標達成
All targets reached
Tip Jar
PayPal - paypal.me/vickyprudhvi
PayPal - paypal.me/vickyprudhvi
相關出版品
免責聲明
這些資訊和出版物並非旨在提供,也不構成TradingView提供或認可的任何形式的財務、投資、交易或其他類型的建議或推薦。請閱讀使用條款以了解更多資訊。
Tip Jar
PayPal - paypal.me/vickyprudhvi
PayPal - paypal.me/vickyprudhvi
相關出版品
免責聲明
這些資訊和出版物並非旨在提供,也不構成TradingView提供或認可的任何形式的財務、投資、交易或其他類型的建議或推薦。請閱讀使用條款以了解更多資訊。