做多
How high will waves go? Chart suggests $56.
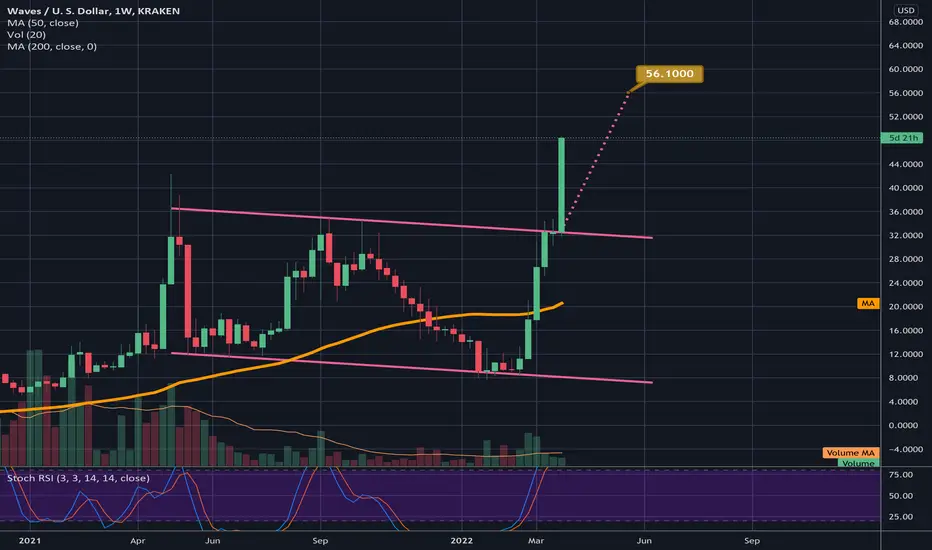
Waves having a crazy bullish pump in which it has reached a new all time high, and based on the chart pattern it broke up from of a falling channel, it should keep going until it reaches its target at $56. I’m guessing a correction from there but it could easily continue higher after cooling off. We can also see a bit of a double bottom inside the channel however the double bottom pattern has the same breakout target as the channel. *not financial advice*
註釋
From its low in January of $8 that will be a 7x and almost 700% gain!註釋
TARGET HIT!
免責聲明
這些資訊和出版物並非旨在提供,也不構成TradingView提供或認可的任何形式的財務、投資、交易或其他類型的建議或推薦。請閱讀使用條款以了解更多資訊。
免責聲明
這些資訊和出版物並非旨在提供,也不構成TradingView提供或認可的任何形式的財務、投資、交易或其他類型的建議或推薦。請閱讀使用條款以了解更多資訊。