
Dear My friends,
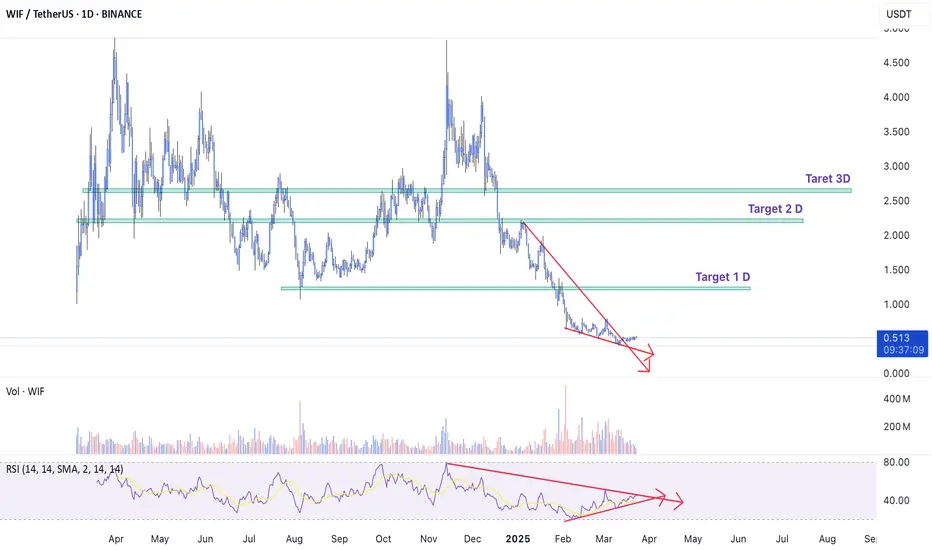
When looking at the WIF chart, I wonder, where is its bottom? The current price is even lower than when it was first listed on Binance. So, since I don’t know, I’ll just analyze it. And I’ll start from the bigger picture. When I zoom into the daily timeframe, everything seems clear to me. Take a look at the daily chart, and you’ll see that a divergence has appeared. The price is dropping, but the RSI indicator is rising. The price has broken out of the descending channel. Buying volume has been dominant in recent sessions. So, I’ve searched for target levels on the daily timeframe. I hope my analysis will help you, my friends.
Best Regards,
When looking at the WIF chart, I wonder, where is its bottom? The current price is even lower than when it was first listed on Binance. So, since I don’t know, I’ll just analyze it. And I’ll start from the bigger picture. When I zoom into the daily timeframe, everything seems clear to me. Take a look at the daily chart, and you’ll see that a divergence has appeared. The price is dropping, but the RSI indicator is rising. The price has broken out of the descending channel. Buying volume has been dominant in recent sessions. So, I’ve searched for target levels on the daily timeframe. I hope my analysis will help you, my friends.
Best Regards,

免責聲明
這些資訊和出版物並非旨在提供,也不構成TradingView提供或認可的任何形式的財務、投資、交易或其他類型的建議或推薦。請閱讀使用條款以了解更多資訊。