
Hello Crypto Lovers,
Mars Signals team wishes you high profits.
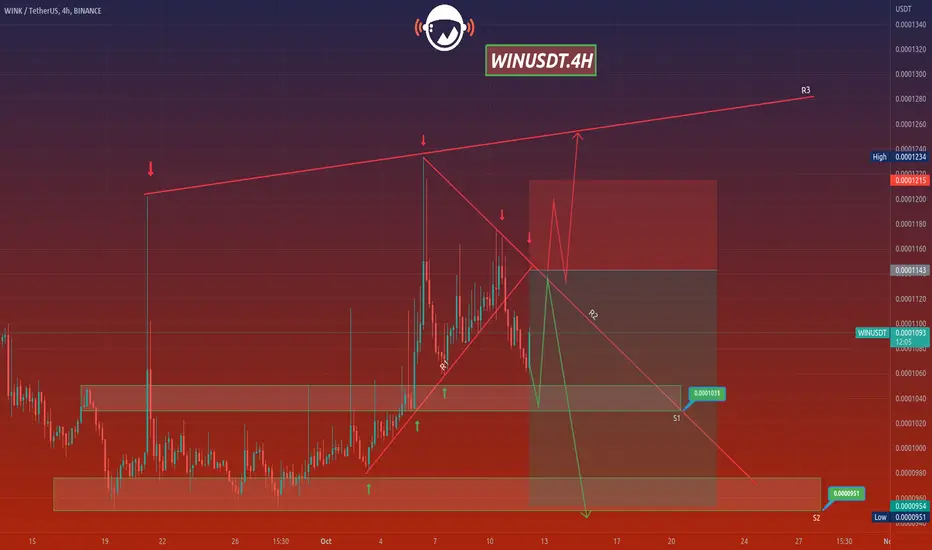
This is a 4-hour-time frame analysis for WINUSDT
In this chart, we have R3 and R2 as the resistance lines that include the disability of the price to rise. R1 used to be a support line and And S1 used to be a resistance area and S2 is a support line. Now the price is fluctuating over S1 and we predict it will rise to R2 and then by being rejected, it will face a decline to S2 area and here our short position is activated. In case the price moves above R2 and fixes there, then it will face more rise. So consider the confirmation candles to have less risky trades.
Warning: This is just a suggestion and we do not guarantee profits. We advise you to analyze the chart before opening any positions.
Wish you luck
Mars Signals team wishes you high profits.
This is a 4-hour-time frame analysis for WINUSDT
In this chart, we have R3 and R2 as the resistance lines that include the disability of the price to rise. R1 used to be a support line and And S1 used to be a resistance area and S2 is a support line. Now the price is fluctuating over S1 and we predict it will rise to R2 and then by being rejected, it will face a decline to S2 area and here our short position is activated. In case the price moves above R2 and fixes there, then it will face more rise. So consider the confirmation candles to have less risky trades.
Warning: This is just a suggestion and we do not guarantee profits. We advise you to analyze the chart before opening any positions.
Wish you luck

免責聲明
這些資訊和出版物並非旨在提供,也不構成TradingView提供或認可的任何形式的財務、投資、交易或其他類型的建議或推薦。請閱讀使用條款以了解更多資訊。
免責聲明
這些資訊和出版物並非旨在提供,也不構成TradingView提供或認可的任何形式的財務、投資、交易或其他類型的建議或推薦。請閱讀使用條款以了解更多資訊。