
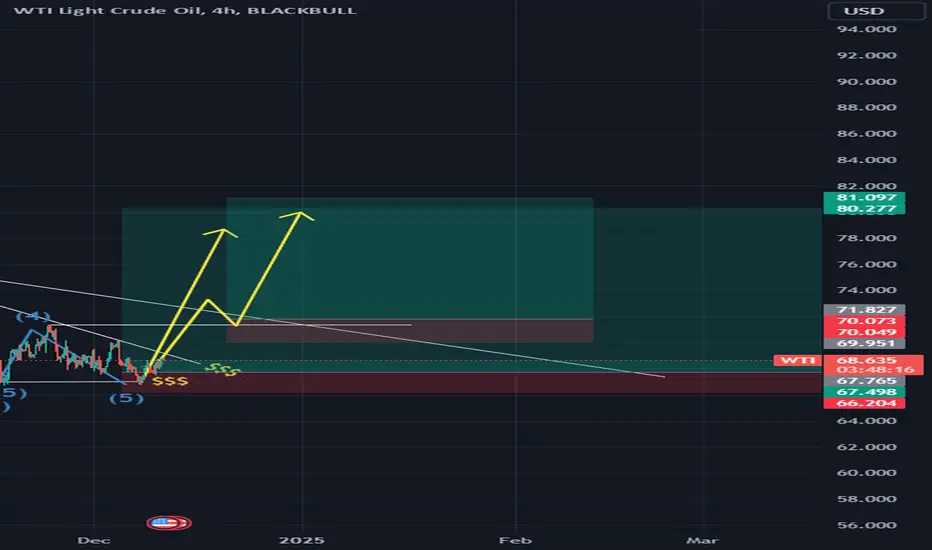
The oil chart is showcasing a large triangle pattern within a smaller triangle, and the breakout of the smaller triangle to the upside strongly suggests that the larger triangle will also be broken. This breakout signals the potential to target significantly higher levels.
Additionally, the bottom has been tested approximately four times, with the last test clearing out all liquidity. Now, the chart appears to be gearing up for a major upward move after a prolonged accumulation phase.
As for my perspective, I’m betting on oil’s rise rather than its decline, even though the current triangle formation is typically a bearish (descending) triangle.
The second entry opportunity will present itself after the larger triangle is broken and confirmed through a retest.
Note: I don't care about the count if it right or not don't comment on that please
交易進行
if you want to know where to enter see this link it is an update with time and target 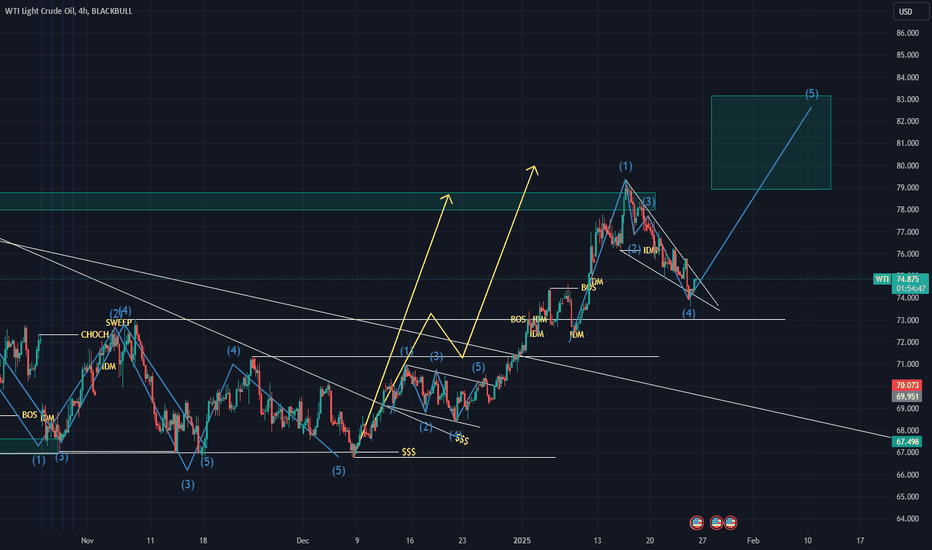
remember sometimes 1 trade is better than 100 trades in a month
this trade has been open 2 months and already took some profit and now going again For long and gets more money

免責聲明
這些資訊和出版物並非旨在提供,也不構成TradingView提供或認可的任何形式的財務、投資、交易或其他類型的建議或推薦。請閱讀使用條款以了解更多資訊。
免責聲明
這些資訊和出版物並非旨在提供,也不構成TradingView提供或認可的任何形式的財務、投資、交易或其他類型的建議或推薦。請閱讀使用條款以了解更多資訊。