
WUSDT technical analysis update
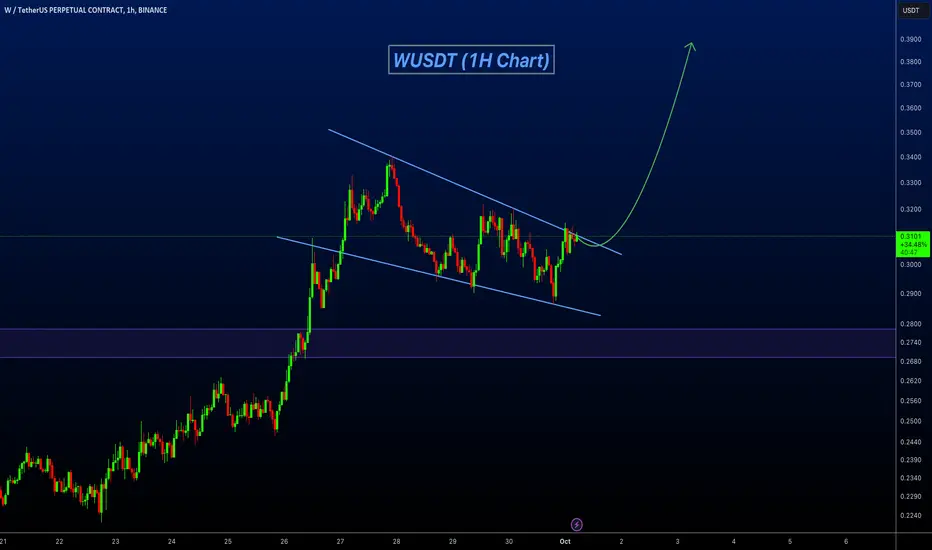
WUSDT has formed a bullish flag pattern on the 1-hour chart, and the price is now moving toward the flag resistance for a potential breakout. The price is currently trading above both the 100 and 200 EMA. Once the breakout is confirmed, we can expect a strong bullish move. Additionally, the price has already broken the double-bottom resistance on the daily chart and formed the flag pattern just above it.
WUSDT has formed a bullish flag pattern on the 1-hour chart, and the price is now moving toward the flag resistance for a potential breakout. The price is currently trading above both the 100 and 200 EMA. Once the breakout is confirmed, we can expect a strong bullish move. Additionally, the price has already broken the double-bottom resistance on the daily chart and formed the flag pattern just above it.

🚀Telegram : t.me/hexatrades
🌐Website: hexatrades.io/
🗣️Twitter(X): twitter.com/HexaTrades
🌐Website: hexatrades.io/
🗣️Twitter(X): twitter.com/HexaTrades
相關出版品
免責聲明
這些資訊和出版物並非旨在提供,也不構成TradingView提供或認可的任何形式的財務、投資、交易或其他類型的建議或推薦。請閱讀使用條款以了解更多資訊。
🚀Telegram : t.me/hexatrades
🌐Website: hexatrades.io/
🗣️Twitter(X): twitter.com/HexaTrades
🌐Website: hexatrades.io/
🗣️Twitter(X): twitter.com/HexaTrades
相關出版品
免責聲明
這些資訊和出版物並非旨在提供,也不構成TradingView提供或認可的任何形式的財務、投資、交易或其他類型的建議或推薦。請閱讀使用條款以了解更多資訊。