
1. The Macro Context (The "Why") 🌍
Hi traders! Before looking at the candles, let's look at the money. My fundamental scoring table is giving us a signal worth examining: the overall pair bias for XAG/USD currently reads N/A, as commodities like Silver do not carry a traditional macro score on both sides. However, the USD leg of this pair comes in at a firm 68/100 (Bullish) — a factor that must be accounted for when building conviction on this setup. 🏦
Key Factor Analysis:
🏦 Current Rates: Explanation: The USD stands at 3.75%, well above the G7 average of 2.39% — a +1.36pp gap that gives the dollar a meaningful yield advantage over its peers. Score XAG: N/A | Score USD: +1
🌍 Economic Regime: Explanation: The US economy is operating in a reflationary/inflationary regime with CPI at 3.3% — above target and trending higher, creating stagflationary pressure that supports a structurally strong dollar. Score XAG: N/A | Score USD: +1
📊 Rate Expectations: Explanation: The Fed is currently holding, but persistent inflation at 3.3% and rising raises the probability of a future hike — reinforcing the hawkish tone and keeping the dollar bid on forward guidance alone. Score XAG: N/A | Score USD: +1
⚖️ Risk Sentiment: Explanation: N/A — no explicit risk sentiment score is available for this commodity pair in the current scoring framework. Score XAG: N/A | Score USD: N/A
🏛️ COT Score: Explanation: Commitment of Traders data shows strong, consolidated long positioning on the USD — institutional players are aligned with the bullish dollar narrative, adding a structural tailwind for the greenback. Score XAG: N/A | Score USD: +1
Currency Score Summary:
Total Score XAG: N/A (N/A)
Total Score USD: 68/100 (Bullish)
Synthesis:
💡 XAG (N/A, Score N/A): Silver as a commodity does not carry a traditional macro scoring framework — its directional bias is driven by USD strength, real yield dynamics, global risk appetite, and physical demand cycles rather than central bank policy in isolation.
💡 USD (Bullish, Score 68/100): Elevated policy rates (3.75%), above-target and accelerating inflation (3.3%) driving hawkish rate expectations, and strong consolidated COT long positioning combine to make the dollar a dominant macro force. Historically, a strong USD creates structural headwinds for XAG/USD.
Conclusion: Given this fundamental backdrop, the macro picture leans toward USD strength — which structurally argues against XAG/USD longs. However, with no confirmed pair bias, the technical and daily structure will act as the decisive filter. We only engage Long if the chart confirms with high-probability setups. 🚫
2. Daily Trend Confirmation (The "Structural Filter") 📅
Macro tells us where the wind blows; the daily chart tells us if the price is actually moving with it. For every swing setup I take, the 1D structure must confirm the macro direction — otherwise the trade is just a guess against the tape.
📅 Daily Trend: Uptrend — the daily chart is firmly bullish on XAG/USD, suggesting that despite a strong USD backdrop, Silver has been driving its own structural momentum higher. This divergence between macro headwinds (USD bullish = bearish pressure on XAGUSD) and price structure (confirmed daily uptrend) is a key variable to monitor — but price structure wins as the primary filter in the short-to-medium term.
🔄 Daily Phase: Monitoring for new breakout — this means the indicator has just validated a new Higher High on the daily timeframe, signaling we are entering a fresh impulsive leg or its first pullback. This is the highest-quality structural timing available for a swing entry — the new leg is just beginning.
Coherence Check: The 1D trend is in conflict with the macro bias. The USD is structurally Bullish (68/100), which traditionally suppresses Silver prices. However, since the overall pair bias is N/A and the daily chart shows a confirmed Uptrend in an early breakout phase, we treat this as a structure-led setup with elevated awareness of USD headwinds. Be cautious — size accordingly and respect your stop loss with discipline.
3. The Technical Setup (The "Where") 📉
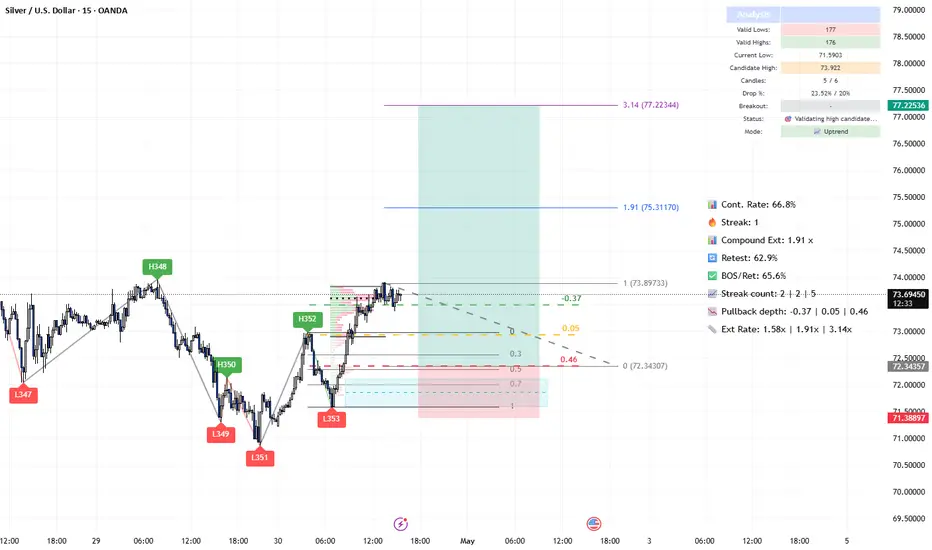
Timeframe: 15m | Pair: XAGUSD
The SMC Market Structure + Price Zones [MaB] indicator has confirmed our statistical edge. Here's the probabilistic data from the dashboard:
🚀 Continuation Rate (66.8%): We are currently above the 60% threshold. This confirms a healthy directional trend where continuation has a much higher probability than a reversal.
🔥 Streak Analysis (1): We are currently on impulse number 1.
* Expected Streak: 2 (Percentile: 50th%)
* Remaining Moves: 1
This indicates a Young trend. The statistical range (20th-80th pct) suggests a typical duration of 2-5 impulses.
🔄 Retest & Reaction:
* Retest Prob (62.9%): The probability of the price returning to test the zone after a BOS.
* BOS/Ret Rate (65.6%): Once inside the zone, this is the probability of a positive reaction leading to a new BOS.
🎯 Extension & Projection:
* Extension Range: The expected extension for this single leg is between 1.58x and 3.14x (Expected: 1.91x).
* Compound Extension (1.91x): This is the total projected move based on the remaining expected impulses. By multiplying the current zone height by this factor, we find our ultimate target.
4. Execution Plan on Chart 🎯
Moving over to the charts, we are using these statistics to define our operational levels:
📍 Entry and Stop Loss: We are placing a limit entry within the Demand Zone 15m (Purple/Blue Band). The stop loss is tucked a few pips outside the zone to protect against structural invalidation.
🏁 Statistical Take Profits (50/30/20 split): Instead of a single arbitrary target, we split the position across 3 extension levels projected by the indicator. Each TP closes a portion of the position to lock in profit progressively. 🏆
Trade Parameters:
💰 Entry Price: 72.34307
🛡️ Stop Loss: 71.38897
🎯 Take Profit Strategy (50/30/20 lot split):
* TP1 (close 50% of position): 73.89733 — 1x extension
* TP2 (close 30% of position): 75.31170 — 1.91x extension
* TP3 (close 20% of position): 77.22344 — 3.14x extension
The 50/30/20 split secures profit at the statistically conservative target (TP1) while letting a portion ride toward the max extension (TP3).
⚠️ Disclaimer: This analysis is based on a proprietary algorithm and is shared exclusively for educational and didactic purposes. It does not constitute financial advice or investment solicitation in any way. Trading involves significant risk.
Hi traders! Before looking at the candles, let's look at the money. My fundamental scoring table is giving us a signal worth examining: the overall pair bias for XAG/USD currently reads N/A, as commodities like Silver do not carry a traditional macro score on both sides. However, the USD leg of this pair comes in at a firm 68/100 (Bullish) — a factor that must be accounted for when building conviction on this setup. 🏦
Key Factor Analysis:
🏦 Current Rates: Explanation: The USD stands at 3.75%, well above the G7 average of 2.39% — a +1.36pp gap that gives the dollar a meaningful yield advantage over its peers. Score XAG: N/A | Score USD: +1
🌍 Economic Regime: Explanation: The US economy is operating in a reflationary/inflationary regime with CPI at 3.3% — above target and trending higher, creating stagflationary pressure that supports a structurally strong dollar. Score XAG: N/A | Score USD: +1
📊 Rate Expectations: Explanation: The Fed is currently holding, but persistent inflation at 3.3% and rising raises the probability of a future hike — reinforcing the hawkish tone and keeping the dollar bid on forward guidance alone. Score XAG: N/A | Score USD: +1
⚖️ Risk Sentiment: Explanation: N/A — no explicit risk sentiment score is available for this commodity pair in the current scoring framework. Score XAG: N/A | Score USD: N/A
🏛️ COT Score: Explanation: Commitment of Traders data shows strong, consolidated long positioning on the USD — institutional players are aligned with the bullish dollar narrative, adding a structural tailwind for the greenback. Score XAG: N/A | Score USD: +1
Currency Score Summary:
Total Score XAG: N/A (N/A)
Total Score USD: 68/100 (Bullish)
Synthesis:
💡 XAG (N/A, Score N/A): Silver as a commodity does not carry a traditional macro scoring framework — its directional bias is driven by USD strength, real yield dynamics, global risk appetite, and physical demand cycles rather than central bank policy in isolation.
💡 USD (Bullish, Score 68/100): Elevated policy rates (3.75%), above-target and accelerating inflation (3.3%) driving hawkish rate expectations, and strong consolidated COT long positioning combine to make the dollar a dominant macro force. Historically, a strong USD creates structural headwinds for XAG/USD.
Conclusion: Given this fundamental backdrop, the macro picture leans toward USD strength — which structurally argues against XAG/USD longs. However, with no confirmed pair bias, the technical and daily structure will act as the decisive filter. We only engage Long if the chart confirms with high-probability setups. 🚫
2. Daily Trend Confirmation (The "Structural Filter") 📅
Macro tells us where the wind blows; the daily chart tells us if the price is actually moving with it. For every swing setup I take, the 1D structure must confirm the macro direction — otherwise the trade is just a guess against the tape.
📅 Daily Trend: Uptrend — the daily chart is firmly bullish on XAG/USD, suggesting that despite a strong USD backdrop, Silver has been driving its own structural momentum higher. This divergence between macro headwinds (USD bullish = bearish pressure on XAGUSD) and price structure (confirmed daily uptrend) is a key variable to monitor — but price structure wins as the primary filter in the short-to-medium term.
🔄 Daily Phase: Monitoring for new breakout — this means the indicator has just validated a new Higher High on the daily timeframe, signaling we are entering a fresh impulsive leg or its first pullback. This is the highest-quality structural timing available for a swing entry — the new leg is just beginning.
Coherence Check: The 1D trend is in conflict with the macro bias. The USD is structurally Bullish (68/100), which traditionally suppresses Silver prices. However, since the overall pair bias is N/A and the daily chart shows a confirmed Uptrend in an early breakout phase, we treat this as a structure-led setup with elevated awareness of USD headwinds. Be cautious — size accordingly and respect your stop loss with discipline.
3. The Technical Setup (The "Where") 📉
Timeframe: 15m | Pair: XAGUSD
The SMC Market Structure + Price Zones [MaB] indicator has confirmed our statistical edge. Here's the probabilistic data from the dashboard:
🚀 Continuation Rate (66.8%): We are currently above the 60% threshold. This confirms a healthy directional trend where continuation has a much higher probability than a reversal.
🔥 Streak Analysis (1): We are currently on impulse number 1.
* Expected Streak: 2 (Percentile: 50th%)
* Remaining Moves: 1
This indicates a Young trend. The statistical range (20th-80th pct) suggests a typical duration of 2-5 impulses.
🔄 Retest & Reaction:
* Retest Prob (62.9%): The probability of the price returning to test the zone after a BOS.
* BOS/Ret Rate (65.6%): Once inside the zone, this is the probability of a positive reaction leading to a new BOS.
🎯 Extension & Projection:
* Extension Range: The expected extension for this single leg is between 1.58x and 3.14x (Expected: 1.91x).
* Compound Extension (1.91x): This is the total projected move based on the remaining expected impulses. By multiplying the current zone height by this factor, we find our ultimate target.
4. Execution Plan on Chart 🎯
Moving over to the charts, we are using these statistics to define our operational levels:
📍 Entry and Stop Loss: We are placing a limit entry within the Demand Zone 15m (Purple/Blue Band). The stop loss is tucked a few pips outside the zone to protect against structural invalidation.
🏁 Statistical Take Profits (50/30/20 split): Instead of a single arbitrary target, we split the position across 3 extension levels projected by the indicator. Each TP closes a portion of the position to lock in profit progressively. 🏆
Trade Parameters:
💰 Entry Price: 72.34307
🛡️ Stop Loss: 71.38897
🎯 Take Profit Strategy (50/30/20 lot split):
* TP1 (close 50% of position): 73.89733 — 1x extension
* TP2 (close 30% of position): 75.31170 — 1.91x extension
* TP3 (close 20% of position): 77.22344 — 3.14x extension
The 50/30/20 split secures profit at the statistically conservative target (TP1) while letting a portion ride toward the max extension (TP3).
⚠️ Disclaimer: This analysis is based on a proprietary algorithm and is shared exclusively for educational and didactic purposes. It does not constitute financial advice or investment solicitation in any way. Trading involves significant risk.
交易結束:目標達成
A very good 5RR win!
Trading indicators development focused on Smart Money Concepts (SMC), market structure analysis, and liquidity zones.
WEBSITE: mab-arreca.com/
WHOP: whop.com/mab-9cb1/
YOUTUBE: youtube.com/@MaB.arreca
WEBSITE: mab-arreca.com/
WHOP: whop.com/mab-9cb1/
YOUTUBE: youtube.com/@MaB.arreca
相關出版品
免責聲明
這些資訊和出版物並非旨在提供,也不構成TradingView提供或認可的任何形式的財務、投資、交易或其他類型的建議或推薦。請閱讀使用條款以了解更多資訊。
Trading indicators development focused on Smart Money Concepts (SMC), market structure analysis, and liquidity zones.
WEBSITE: mab-arreca.com/
WHOP: whop.com/mab-9cb1/
YOUTUBE: youtube.com/@MaB.arreca
WEBSITE: mab-arreca.com/
WHOP: whop.com/mab-9cb1/
YOUTUBE: youtube.com/@MaB.arreca
相關出版品
免責聲明
這些資訊和出版物並非旨在提供,也不構成TradingView提供或認可的任何形式的財務、投資、交易或其他類型的建議或推薦。請閱讀使用條款以了解更多資訊。