
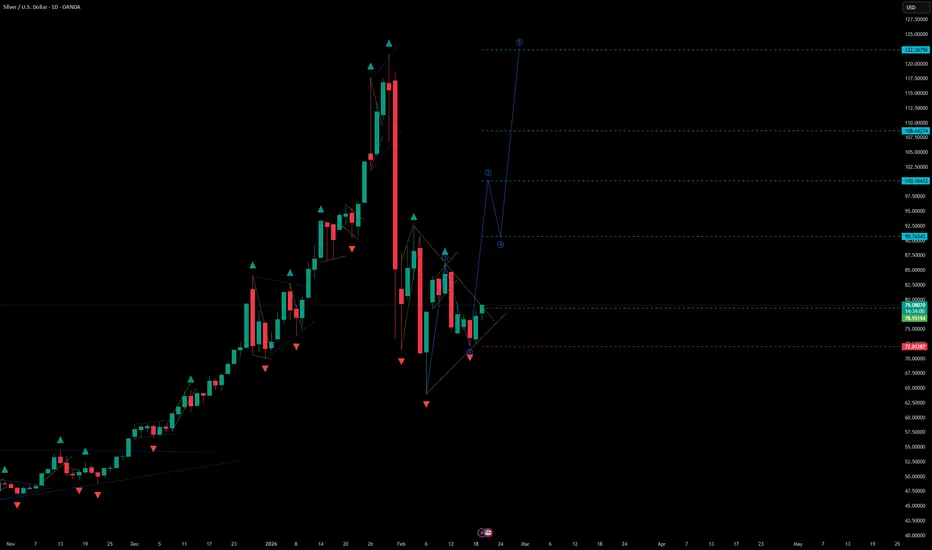
Silver (XAGUSD) — D1 Formation of a Potential Wave 3 + Trendline Break (Bullish Continuation)
🔎 Market Structure (D1)
On the daily timeframe, Silver is forming the technical conditions for the development of Wave 3 to the upside, confirmed by:
a breakout above the corrective trendline (trendline break)
completion of the corrective phase (Wave 2) with a compression structure
rebound from a local support zone after the pullback
recovery of bullish structure after the impulse base was formed
The current price action fits a classic Elliott Wave continuation model, where Wave 3 starts after price exits the corrective structure and resumes the dominant trend.
📐 Elliott Wave Context
Wave 1: initial impulsive move up
Wave 2: corrective pullback / consolidation within structure
Wave 3: expected impulsive expansion higher (current scenario)
📌 Key principle:
The bullish scenario remains valid as long as price holds above the invalidation level (below).
📍 Entry
Entry: 78.55194
The entry is positioned:
after the trendline breakout (structure shift confirmation)
in the impulse activation zone following Wave 2 completion
aligned with continuation momentum rather than chasing the top
🎯 Target Levels (Wave 3 Projections)
Targets are derived from projected impulse expansion zones and key reaction levels:
TP1: 90.74343
TP2: 100.16412
TP3: 108.64274
TP4: 122.36796
Each target acts as a potential reaction area and a logical level for partial profit-taking as Wave 3 progresses.
🛑 Invalidation / Stop Loss
Stop Loss: 72.01287
📍 The stop is placed below the key structural low (base of the prior leg), which:
invalidates the Wave 3 bullish continuation if breached
signals a deeper corrective structure or trend failure
follows Elliott Wave risk management by protecting against a full structure shift
🧠 Risk & Trade Management
Trend-following setup
Wave 3 is typically the strongest wave, but volatility can increase.
Recommended approach:
partial profits at TP1 / TP2
move stop to breakeven after a clean impulsive continuation is confirmed
consider scaling only on pullbacks (intrawave retracements) within Wave 3
if price falls back under the broken trendline and holds, reassess the bullish scenario
📌 Summary
XAGUSD on D1 shows a corrective trendline breakout and signs of Wave 2 completion, supporting a potential Wave 3 continuation to the upside.
The bullish scenario remains valid above 72.01287, with upside targets at 90.74343 → 100.16412 → 108.64274 → 122.36796.
🔎 Market Structure (D1)
On the daily timeframe, Silver is forming the technical conditions for the development of Wave 3 to the upside, confirmed by:
a breakout above the corrective trendline (trendline break)
completion of the corrective phase (Wave 2) with a compression structure
rebound from a local support zone after the pullback
recovery of bullish structure after the impulse base was formed
The current price action fits a classic Elliott Wave continuation model, where Wave 3 starts after price exits the corrective structure and resumes the dominant trend.
📐 Elliott Wave Context
Wave 1: initial impulsive move up
Wave 2: corrective pullback / consolidation within structure
Wave 3: expected impulsive expansion higher (current scenario)
📌 Key principle:
The bullish scenario remains valid as long as price holds above the invalidation level (below).
📍 Entry
Entry: 78.55194
The entry is positioned:
after the trendline breakout (structure shift confirmation)
in the impulse activation zone following Wave 2 completion
aligned with continuation momentum rather than chasing the top
🎯 Target Levels (Wave 3 Projections)
Targets are derived from projected impulse expansion zones and key reaction levels:
TP1: 90.74343
TP2: 100.16412
TP3: 108.64274
TP4: 122.36796
Each target acts as a potential reaction area and a logical level for partial profit-taking as Wave 3 progresses.
🛑 Invalidation / Stop Loss
Stop Loss: 72.01287
📍 The stop is placed below the key structural low (base of the prior leg), which:
invalidates the Wave 3 bullish continuation if breached
signals a deeper corrective structure or trend failure
follows Elliott Wave risk management by protecting against a full structure shift
🧠 Risk & Trade Management
Trend-following setup
Wave 3 is typically the strongest wave, but volatility can increase.
Recommended approach:
partial profits at TP1 / TP2
move stop to breakeven after a clean impulsive continuation is confirmed
consider scaling only on pullbacks (intrawave retracements) within Wave 3
if price falls back under the broken trendline and holds, reassess the bullish scenario
📌 Summary
XAGUSD on D1 shows a corrective trendline breakout and signs of Wave 2 completion, supporting a potential Wave 3 continuation to the upside.
The bullish scenario remains valid above 72.01287, with upside targets at 90.74343 → 100.16412 → 108.64274 → 122.36796.

免責聲明
這些資訊和出版物並非旨在提供,也不構成TradingView提供或認可的任何形式的財務、投資、交易或其他類型的建議或推薦。請閱讀使用條款以了解更多資訊。
免責聲明
這些資訊和出版物並非旨在提供,也不構成TradingView提供或認可的任何形式的財務、投資、交易或其他類型的建議或推薦。請閱讀使用條款以了解更多資訊。